Free Access
Fig. B.1.
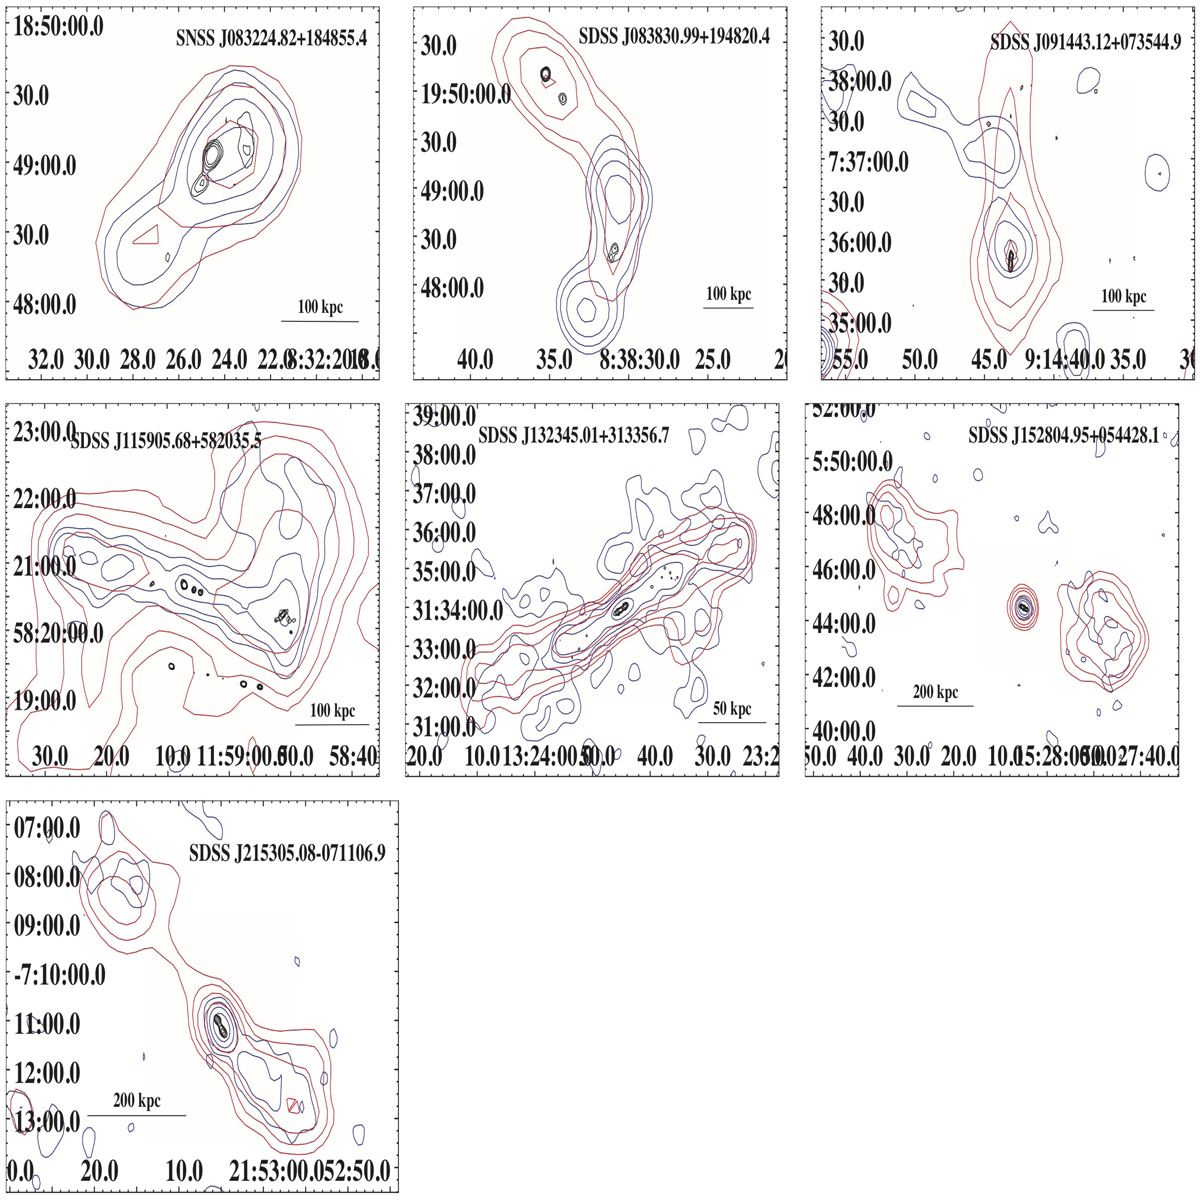
Images of sources with extended emission detected in NVSS. Black, red, and blue contours correspond to the emission seen in FIRST, NVSS, and TGSS. Contours are drawn using the parameters shown in Table E.2.
Current usage metrics show cumulative count of Article Views (full-text article views including HTML views, PDF and ePub downloads, according to the available data) and Abstracts Views on Vision4Press platform.
Data correspond to usage on the plateform after 2015. The current usage metrics is available 48-96 hours after online publication and is updated daily on week days.
Initial download of the metrics may take a while.