Fig. A.1.
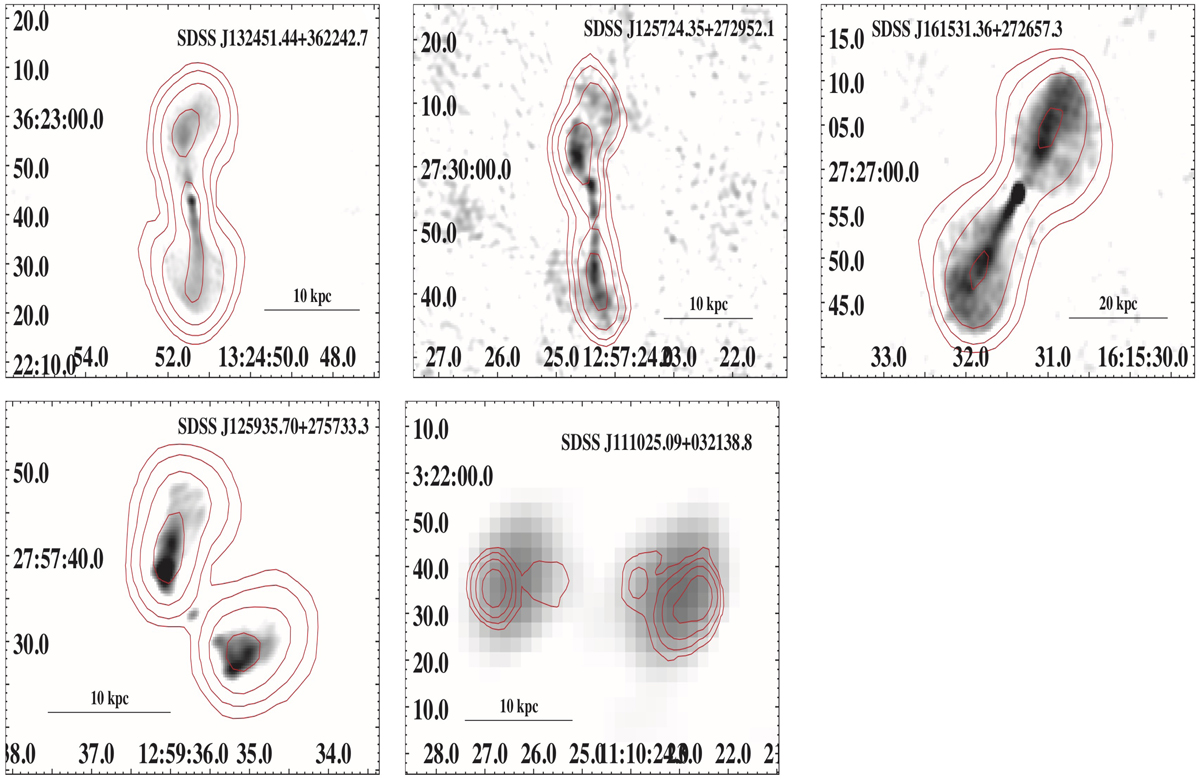
Images of sources with different radio morphologies seen in VLA. Contours are drawn using the parameters shown in Table E.1. The first three images correspond to small FRI sources like those selected in Capetti et al. (2017b) (the first was excluded from our sample because of its FIRST morphology). The fourth image corresponds to a WAT source (see Owen & Rudnick 1976) and the last image shows a star-forming galaxy excluded from the sample.
Current usage metrics show cumulative count of Article Views (full-text article views including HTML views, PDF and ePub downloads, according to the available data) and Abstracts Views on Vision4Press platform.
Data correspond to usage on the plateform after 2015. The current usage metrics is available 48-96 hours after online publication and is updated daily on week days.
Initial download of the metrics may take a while.