Free Access
Fig. 16.
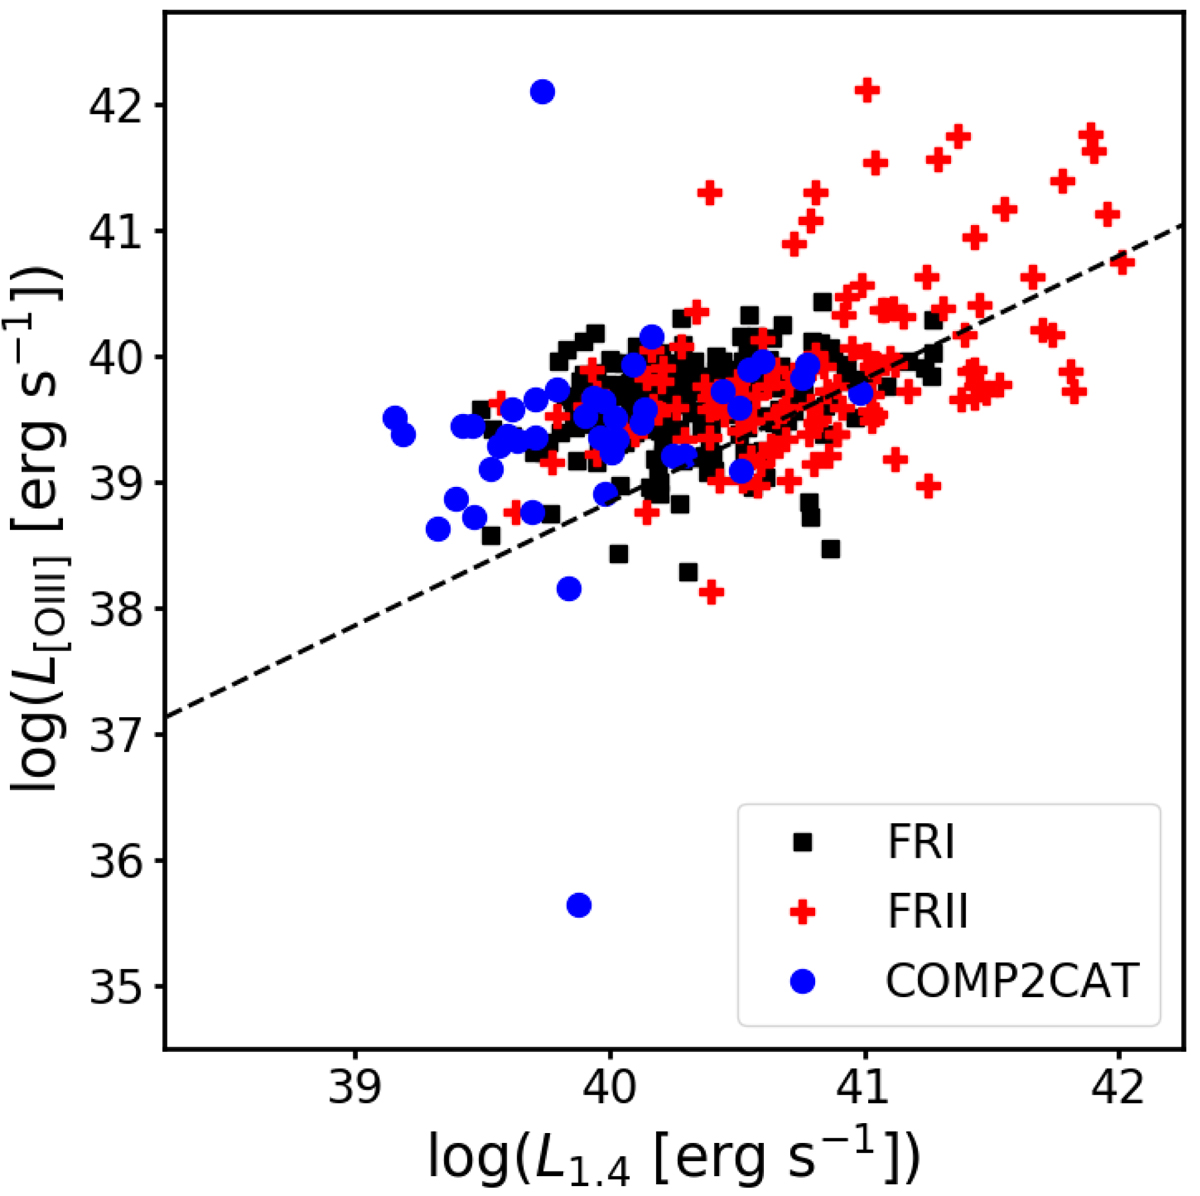
[O III] line luminosity vs. radio luminosity at 1.4 GHz for COMP2CAT sources (blue dots), FRICAT sources (black squares), and FRIICAT sources (red crosses). The black dashed line shows the linear correlation between these two quantities derived from the FR Is of the 3C sample from Buttiglione et al. (2010).
Current usage metrics show cumulative count of Article Views (full-text article views including HTML views, PDF and ePub downloads, according to the available data) and Abstracts Views on Vision4Press platform.
Data correspond to usage on the plateform after 2015. The current usage metrics is available 48-96 hours after online publication and is updated daily on week days.
Initial download of the metrics may take a while.