Fig. 15.
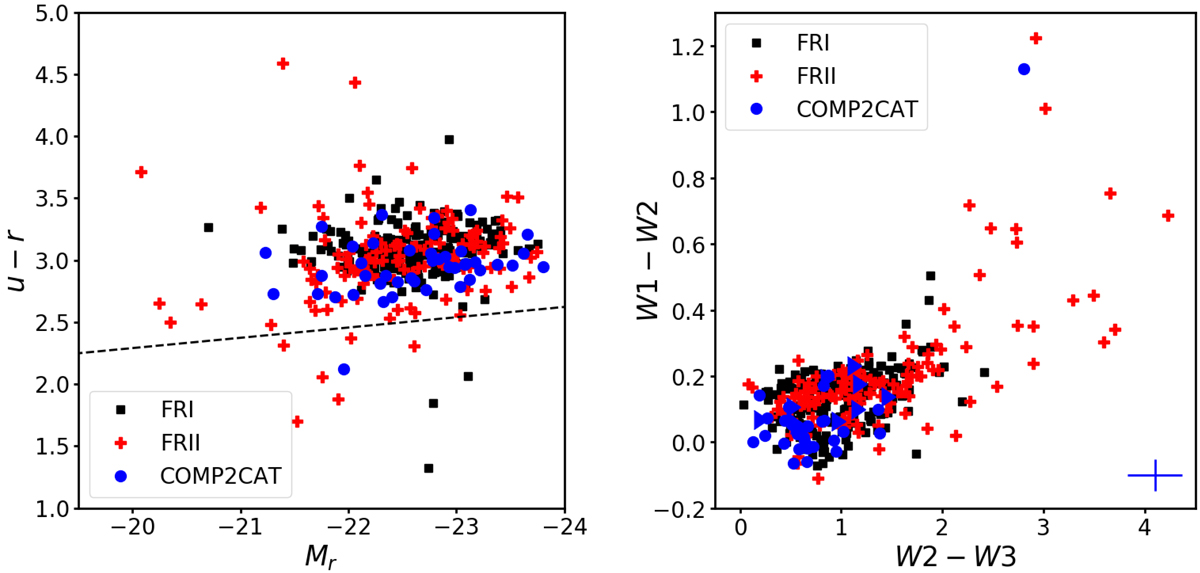
Left: u − r color vs. absolute r-band magnitude (Mr) for COMP2CAT, FRICAT, and FRIICAT hosts (blue dots, black squares, and red crosses). The dashed line separates the blue ETG from the red sequence, following the definition published by Schawinski et al. (2009). Right: WISE mid-IR colors of COMP2CAT, FRICAT, and FRIICAT hosts with the same color-coding as in the Fig. 14. The blue cross in the bottom right corner of the plot represents the average error on the colors.
Current usage metrics show cumulative count of Article Views (full-text article views including HTML views, PDF and ePub downloads, according to the available data) and Abstracts Views on Vision4Press platform.
Data correspond to usage on the plateform after 2015. The current usage metrics is available 48-96 hours after online publication and is updated daily on week days.
Initial download of the metrics may take a while.