Fig. 14.
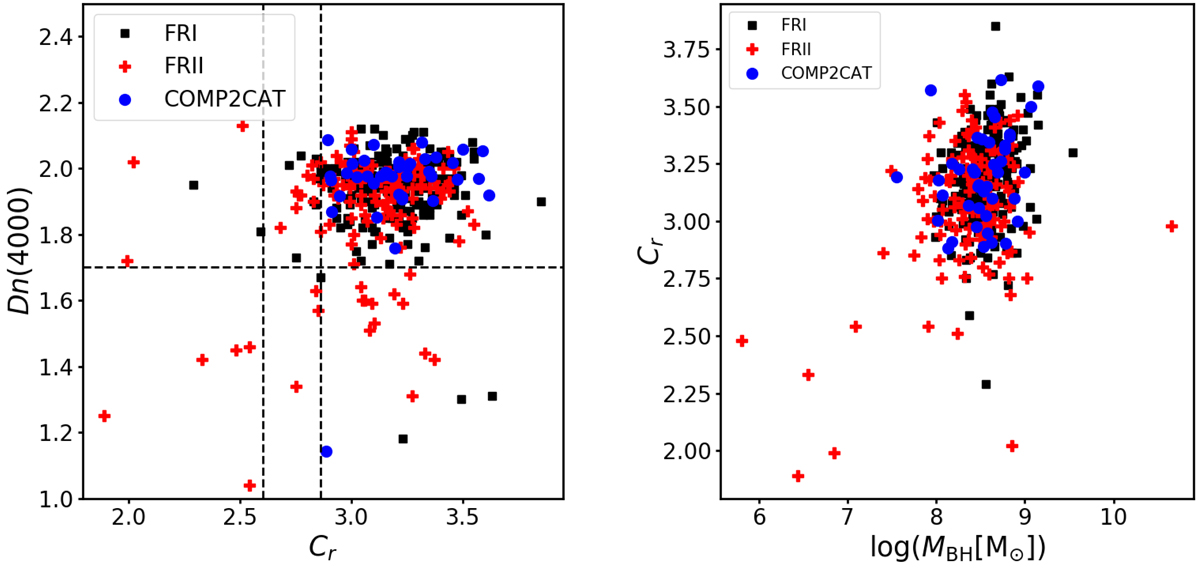
Left: Dn(4000) index vs. concentration index Cr for COMP2CAT (blue dots), FRICAT (black squares), and FRIICAT (red crosses). The black dashed lines represent the values of Cr and Dn(4000) indices that, according to Nakamura et al. (2003), Shen et al. (2003), Strateva et al. (2001), Kauffmann et al. (2003), Bell et al. (2003), and Capetti & Raiteri (2015) correspond to ETGs. Right: concentration index Cr vs. logarithm of the black hole mass (in solar units) with the same color-coding as the image on the left.
Current usage metrics show cumulative count of Article Views (full-text article views including HTML views, PDF and ePub downloads, according to the available data) and Abstracts Views on Vision4Press platform.
Data correspond to usage on the plateform after 2015. The current usage metrics is available 48-96 hours after online publication and is updated daily on week days.
Initial download of the metrics may take a while.