Fig. 12.
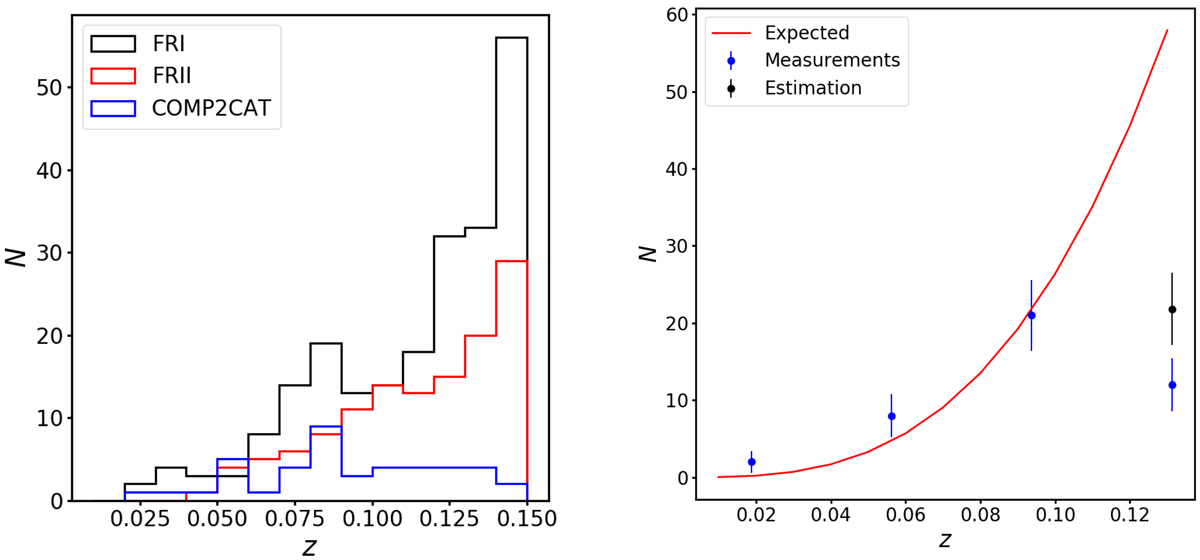
Left: histograms showing the redshift distribution of COMP2CAT (blue), FRICAT (black), and FRIICAT (red) sources. Right: observed redshift distribution (blue dots) and expected redshift distribution (red line). The black dot corresponds to the number of galaxies that would be present if the only effects playing a role were the low luminosities and the small sizes of the sources.
Current usage metrics show cumulative count of Article Views (full-text article views including HTML views, PDF and ePub downloads, according to the available data) and Abstracts Views on Vision4Press platform.
Data correspond to usage on the plateform after 2015. The current usage metrics is available 48-96 hours after online publication and is updated daily on week days.
Initial download of the metrics may take a while.