Fig. 9
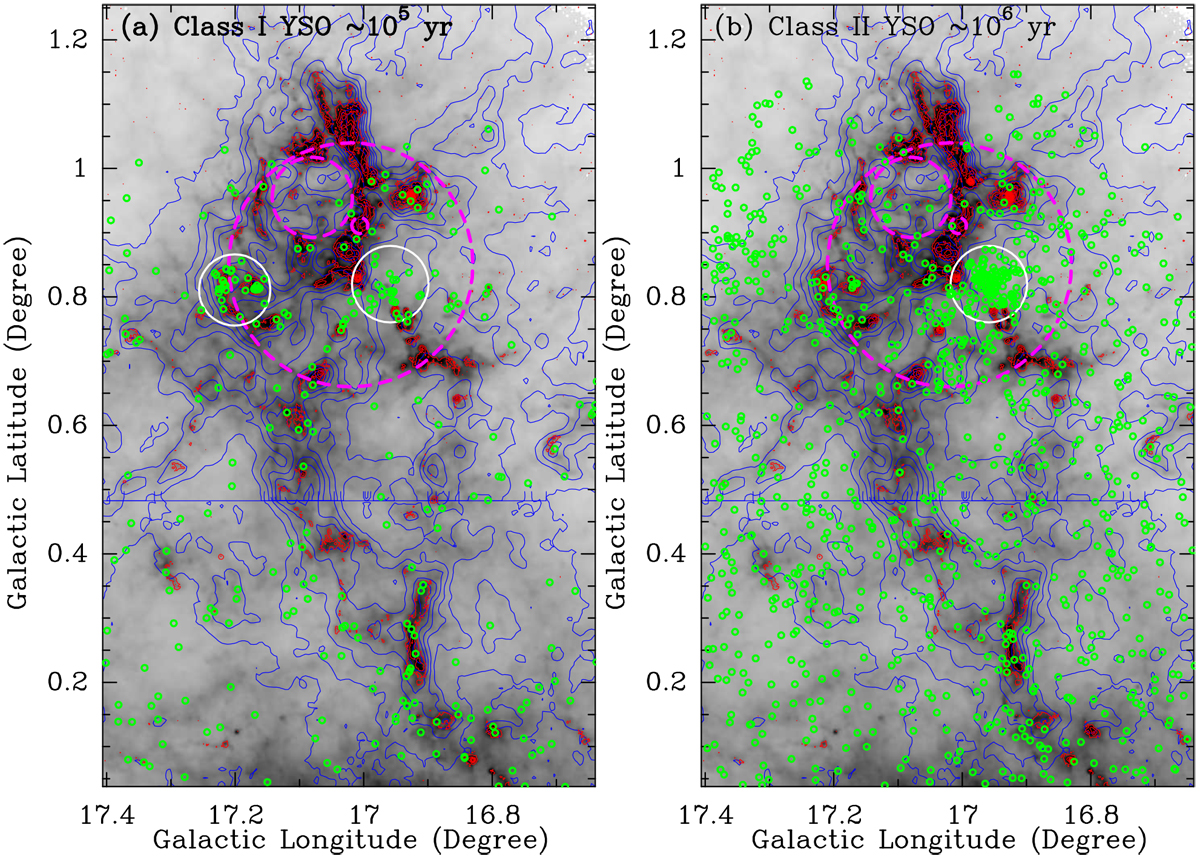
13CO J = 1− 0 emission (blue contours) and 870 μm emission (red contours) superimposed on the Herschel 250 μm emission in grayscale. The green circles represent the identified class I and II YSOs. The white circles outline the regions of YSO accumulation. Panel a: distribution of the Class I YSOs. Panel b: distribution of Class II YSOs.
Current usage metrics show cumulative count of Article Views (full-text article views including HTML views, PDF and ePub downloads, according to the available data) and Abstracts Views on Vision4Press platform.
Data correspond to usage on the plateform after 2015. The current usage metrics is available 48-96 hours after online publication and is updated daily on week days.
Initial download of the metrics may take a while.