Free Access
Fig. 7
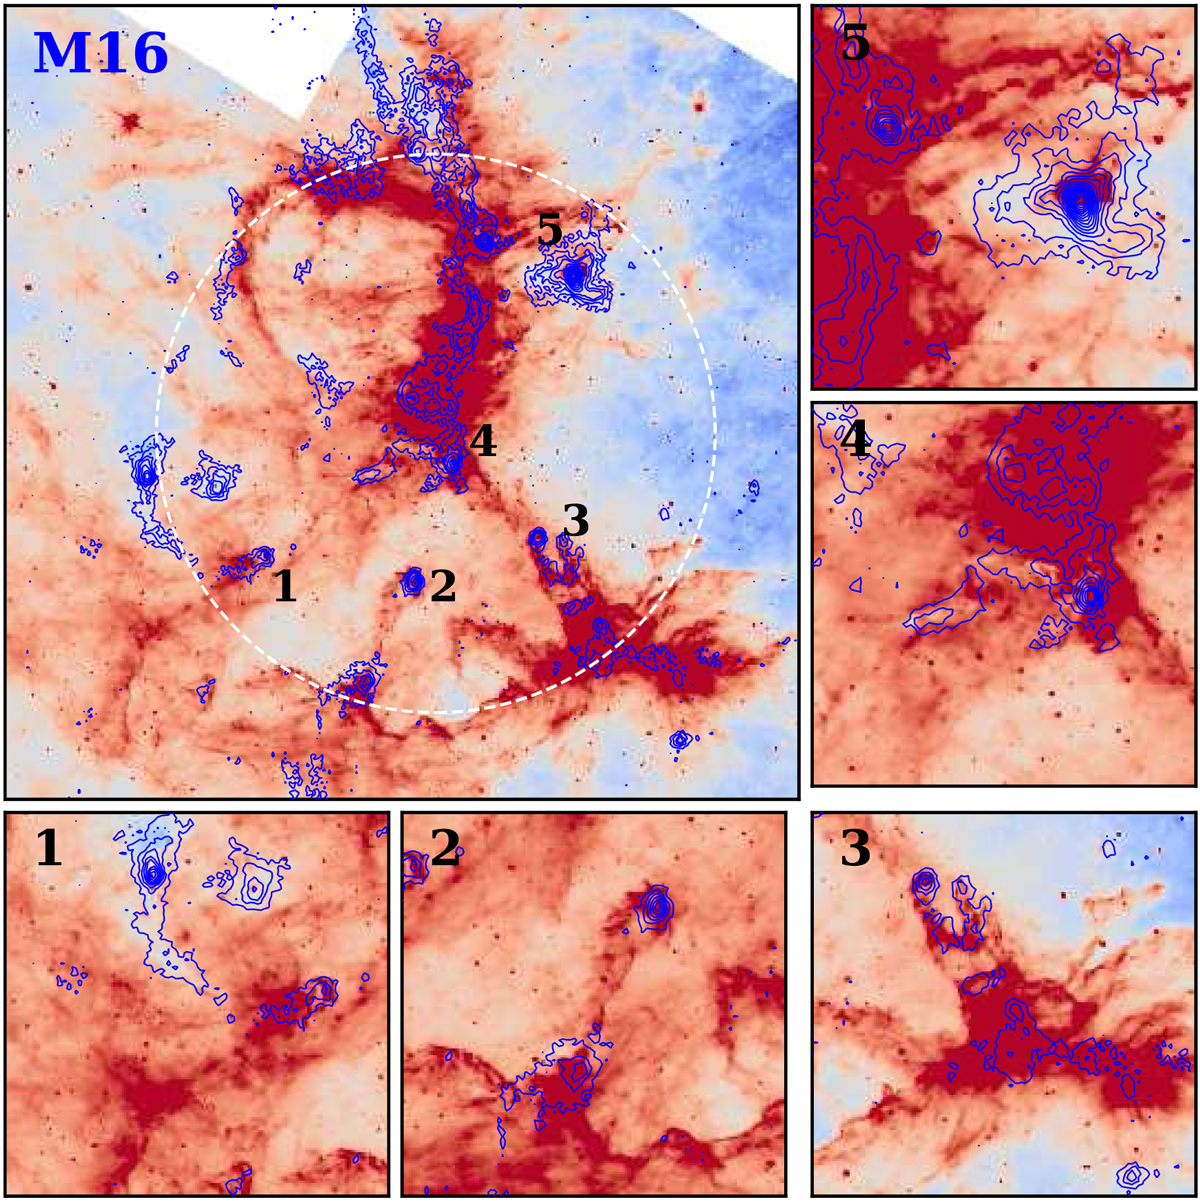
870 μm emission (blue contours) superimposed on the Spitzer-IRAC 8 μm emission (red). The typical pillars and compact cores also are shown in the zoomed image. The white dashed circle outlines the M 16 H II region. The blue contour levels start from 0.06 Jy beam−1 (3σ) in steps of 0.3 Jy beam−1.
Current usage metrics show cumulative count of Article Views (full-text article views including HTML views, PDF and ePub downloads, according to the available data) and Abstracts Views on Vision4Press platform.
Data correspond to usage on the plateform after 2015. The current usage metrics is available 48-96 hours after online publication and is updated daily on week days.
Initial download of the metrics may take a while.