Fig. 6
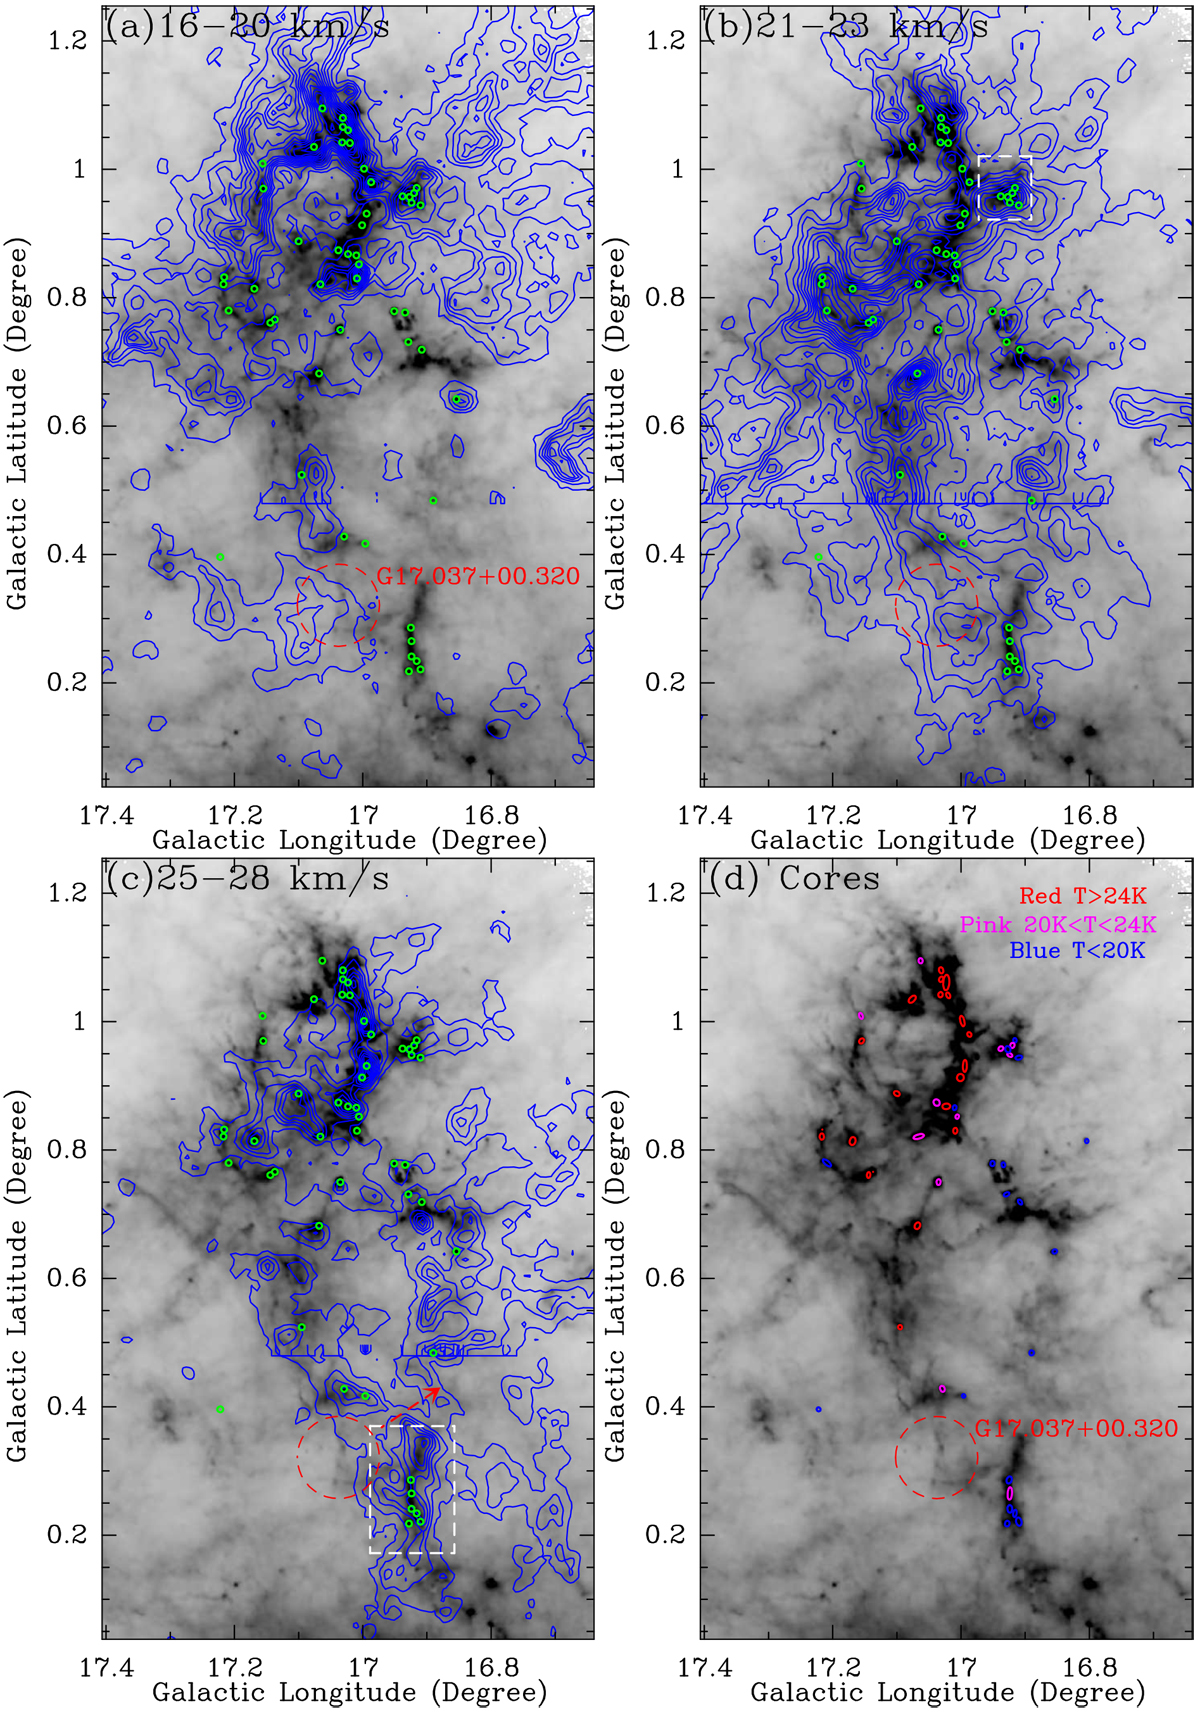
Panels a–c: the 13CO J = 1− 0 emission in blue contours overlaid on the Herschel 250 μm emission in grayscale. The integrated-velocity ranges are shown on top of each image. The green circles represent the 870 μm dust cores, while the red dashed circle shows the position and size of G17.037+0.320 H II region from Anderson et al. (2014). The red arrow may present the shock direction. The two white dashed boxes indicate the compact region with six dust cores. Panel d: the ellipses also mark the positions, sizes, and position angles of the 870 μm dust cores, which are given in Table 1. The different colors mark the cores with different temperatures (T). If T > 24 K, the cores are marked in red, for 10 K < T < 24 K and T < 10 K in pinkand blue, respectively.
Current usage metrics show cumulative count of Article Views (full-text article views including HTML views, PDF and ePub downloads, according to the available data) and Abstracts Views on Vision4Press platform.
Data correspond to usage on the plateform after 2015. The current usage metrics is available 48-96 hours after online publication and is updated daily on week days.
Initial download of the metrics may take a while.