Fig. 5
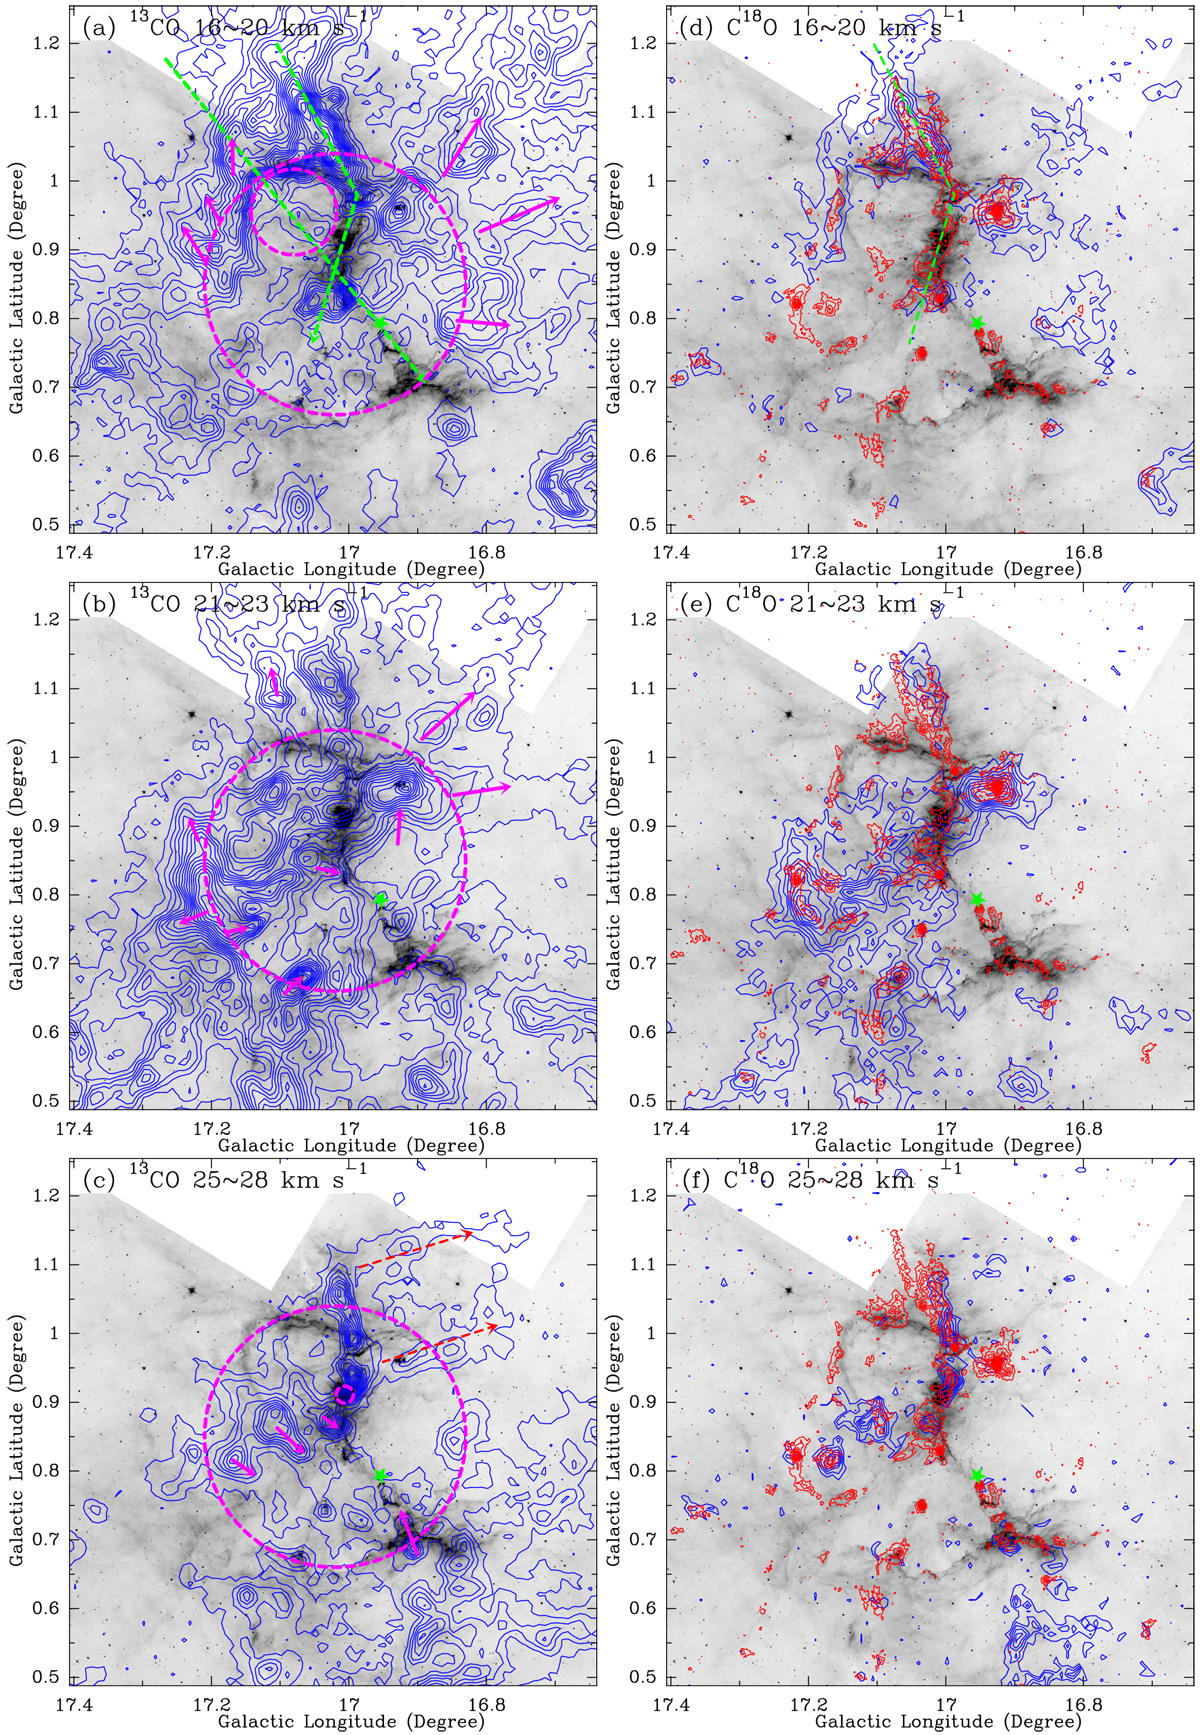
Panels a–c: 13CO integrated intensity maps (blue contours) superimposed on the Spitzer-IRAC 8 μm emission (gray). The integrated-velocity ranges are shown on top of each image. The pink arrows mark the pillars, while the red dashed arrows indicate two gas flows. The blue contour levels start from 0.2 K km s−1(5σ) in a step of 1.6 K km s−1. The pink dashed circles represent M 16, N19, and RCW165. The green star marks the NGC 6611 cluster ionizing M 16. Panels d–f: C18O integrated intensity images overlaid with the ATLASGAL 870 μm (red contours) and 8 μm emission (gray). The blue contour levels start from 0.15 K km s−1(5σ) in a step of 0.75 K km s−1, while the redcontour levels start from 0.06 Jy beam−1 (3σ) in a step of 0.3 Jy beam−1. The green dashed lines mark the directions of position–velocity diagrams in Fig. 10.
Current usage metrics show cumulative count of Article Views (full-text article views including HTML views, PDF and ePub downloads, according to the available data) and Abstracts Views on Vision4Press platform.
Data correspond to usage on the plateform after 2015. The current usage metrics is available 48-96 hours after online publication and is updated daily on week days.
Initial download of the metrics may take a while.