Fig. 3
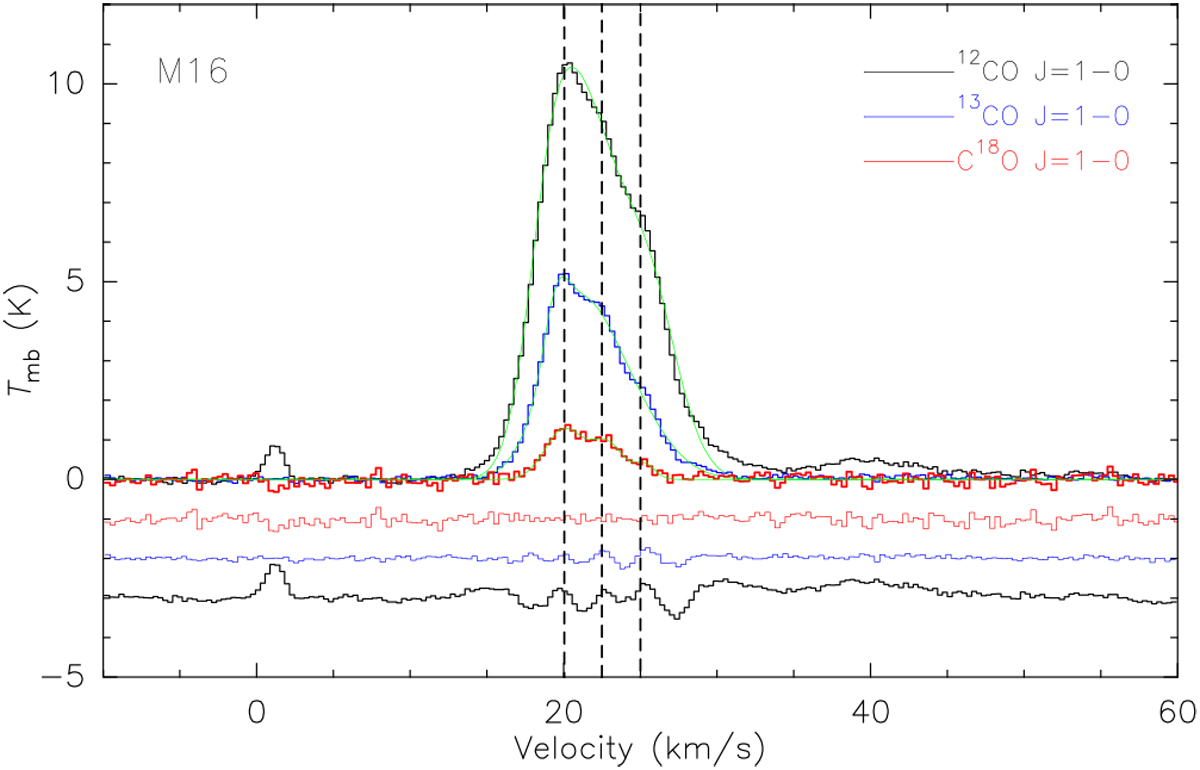
Averaged spectra of 12CO J = 1− 0, 13CO J = 1− 0, and C18O J = 1− 0 over the entire M 16. We note that the intensities of 13CO J = 1− 0, and C18O J = 1− 0 are multiplied by a factor of 2 and 5 for clarity, respectively. The green lines represent the Gaussian fitted lines, with the resulting residuals shown below. The black vertical dashed lines mark the different velocity components.
Current usage metrics show cumulative count of Article Views (full-text article views including HTML views, PDF and ePub downloads, according to the available data) and Abstracts Views on Vision4Press platform.
Data correspond to usage on the plateform after 2015. The current usage metrics is available 48-96 hours after online publication and is updated daily on week days.
Initial download of the metrics may take a while.