Fig. 2
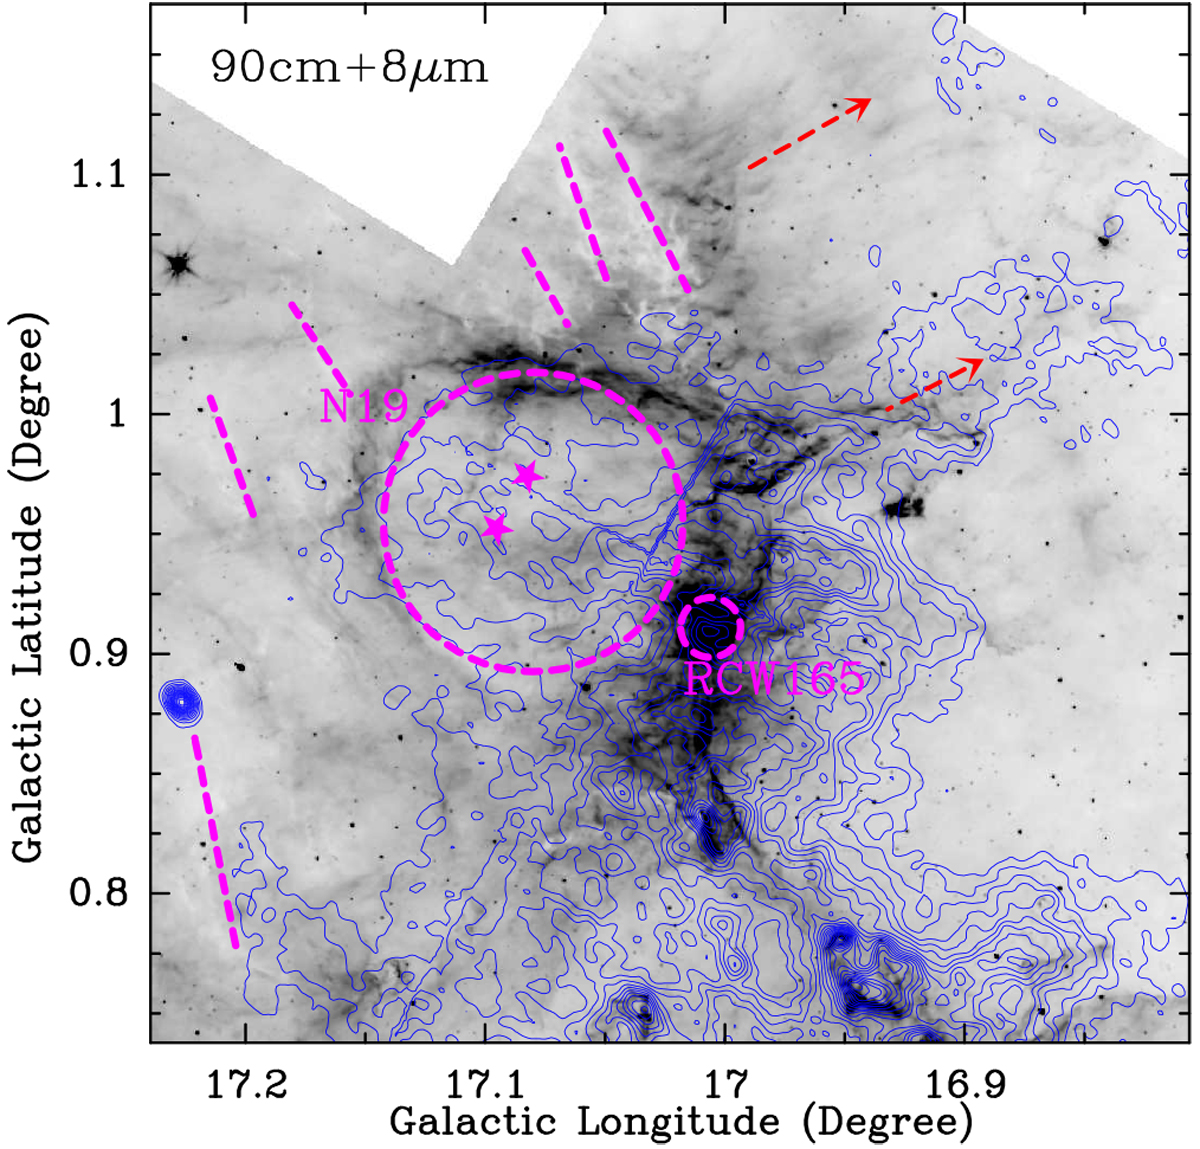
90 cm emission (blue contours) superimposed on the Spitzer-IRAC 8 μm emission (grayscale). The pink dashed circles represent bubbles N19 and RCW165. The contour levels start from 0.021 Jy beam−1 (3σ) in steps of 3σ. The pink dashed lines indicate the dark IR clouds (Peretto & Fuller 2009), while the red arrows show two gas flows. The pink stars mark the positions of the two ionizing stars of N19 (Evans et al. 2005).
Current usage metrics show cumulative count of Article Views (full-text article views including HTML views, PDF and ePub downloads, according to the available data) and Abstracts Views on Vision4Press platform.
Data correspond to usage on the plateform after 2015. The current usage metrics is available 48-96 hours after online publication and is updated daily on week days.
Initial download of the metrics may take a while.