Fig. 12
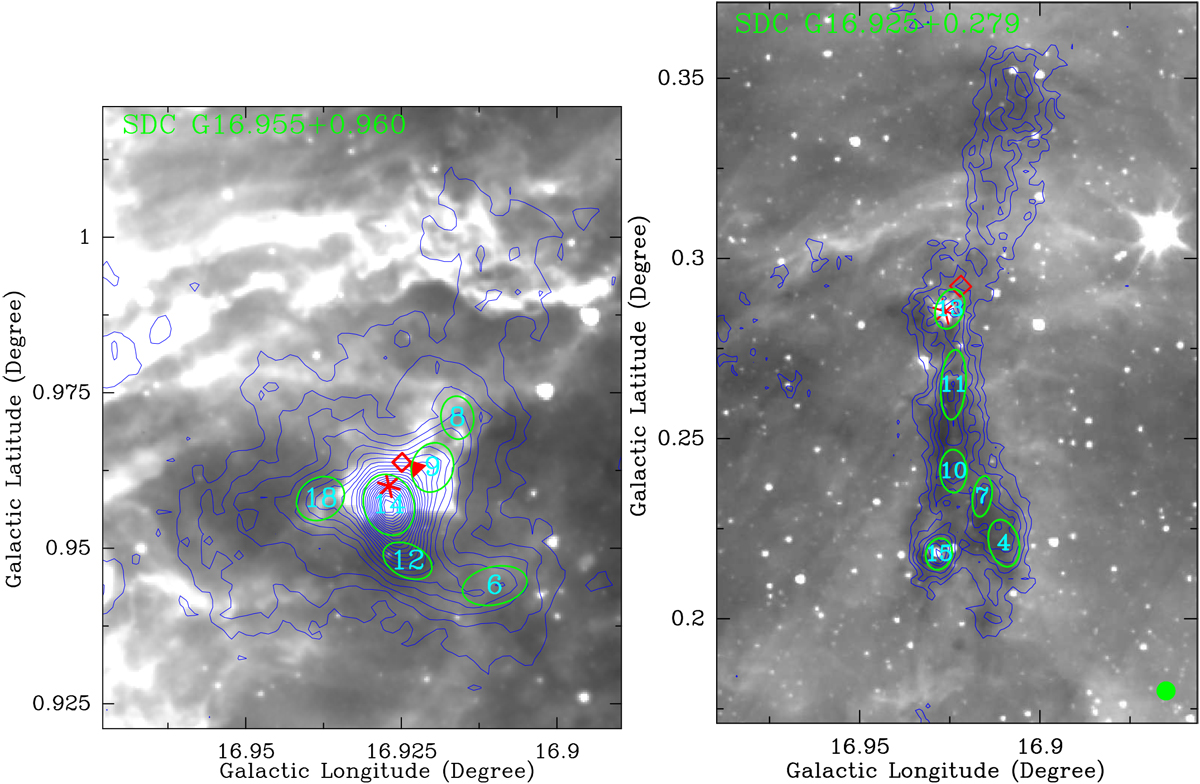
870 μm emission (blue contours) superimposed on the 8 μm emission (gray). The two regions are as also shown in the two white dashed boxes in Fig. 6. The blue contour levels start from 3σ (0.15 Jy beam−1) and rise in steps of 2σ. The green ellipses represent the 870 μm cores. The red stars mark the positions of the MSX6C G016.9270+00.9599 and MSX6C G016.9261+00.2854 H II regions (Urquhart et al. 2011). The red squares indicate IRAS sources, while the red triangle shows the water maser (Braz & Epchtein 1983). The ATLASGAL beam (19′′) is shown as the green filled circle in the bottom right-hand corner.
Current usage metrics show cumulative count of Article Views (full-text article views including HTML views, PDF and ePub downloads, according to the available data) and Abstracts Views on Vision4Press platform.
Data correspond to usage on the plateform after 2015. The current usage metrics is available 48-96 hours after online publication and is updated daily on week days.
Initial download of the metrics may take a while.