Fig. 10
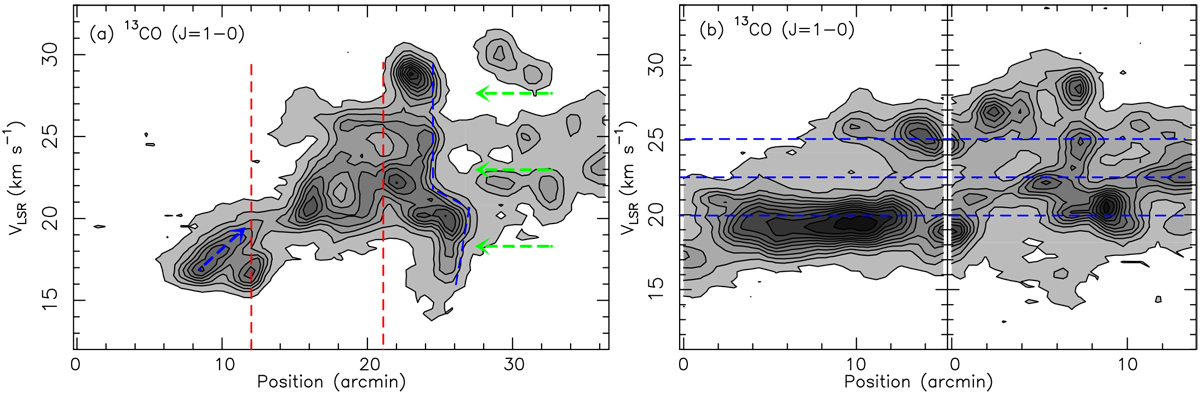
Panel a: position–velocity diagram of the 13CO J = 1− 0 emission along the northwest of the N19 bubble (see the green dashed lines in Fig. 5a panel). The red dashed lines mark the edges of the N19 bubble. The green arrows show the direction of the interaction between the HII region of M 16 and the molecular gas. The blue arrow shows the high-velocity gas, whileblue dashed lines indicate the compressed positions. Panel b: position–velocity diagram of the 13CO J = 1− 0 emission along the NS filament (see the green dashed lines in Fig. 5 a panel). The blue dashed lines shows the three velocity components, which are mentioned in Sect. 3.2. We refer to the discussion about the PV diagrams in Sect. 4.1
Current usage metrics show cumulative count of Article Views (full-text article views including HTML views, PDF and ePub downloads, according to the available data) and Abstracts Views on Vision4Press platform.
Data correspond to usage on the plateform after 2015. The current usage metrics is available 48-96 hours after online publication and is updated daily on week days.
Initial download of the metrics may take a while.