Fig. 9.
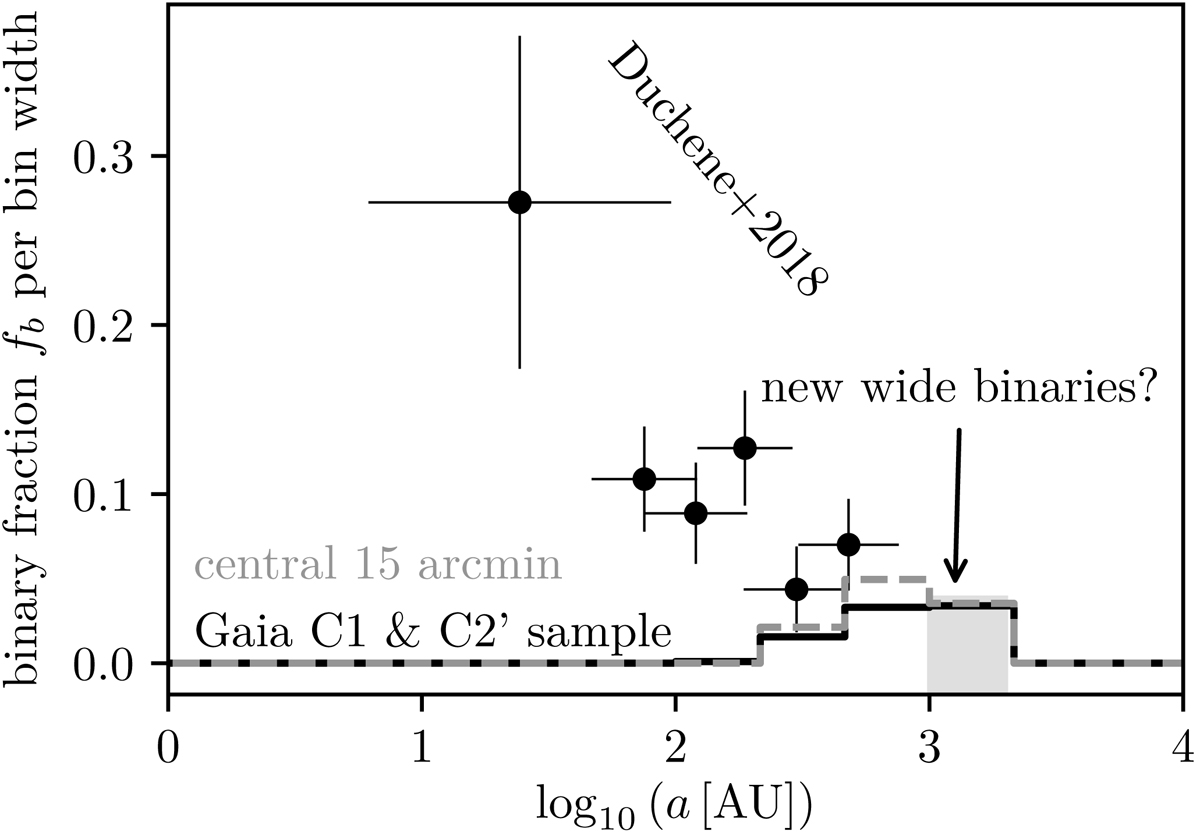
Binary fraction, defined as the number of binaries over the total number of objects, normalized by the bin width. The black points are data for the ONC from Duchêne et al. (1825). The black histogram shows fb for the spatially not constrained region, that is Gaia DR2 data with C1 and C2 selections. The gray dashed histogram shows the data only for the central part that is the same as in the study by Scally et al. (1999). The last bin showing wide binaries in the range 1000−3000 au represents newly discovered potential binaries that seemed to be absent (Scally et al. 1999) (see Fig. 8). The limit 3000 au is motivated by the beginning of the elbow in Fig. 7.
Current usage metrics show cumulative count of Article Views (full-text article views including HTML views, PDF and ePub downloads, according to the available data) and Abstracts Views on Vision4Press platform.
Data correspond to usage on the plateform after 2015. The current usage metrics is available 48-96 hours after online publication and is updated daily on week days.
Initial download of the metrics may take a while.