Fig. 8.
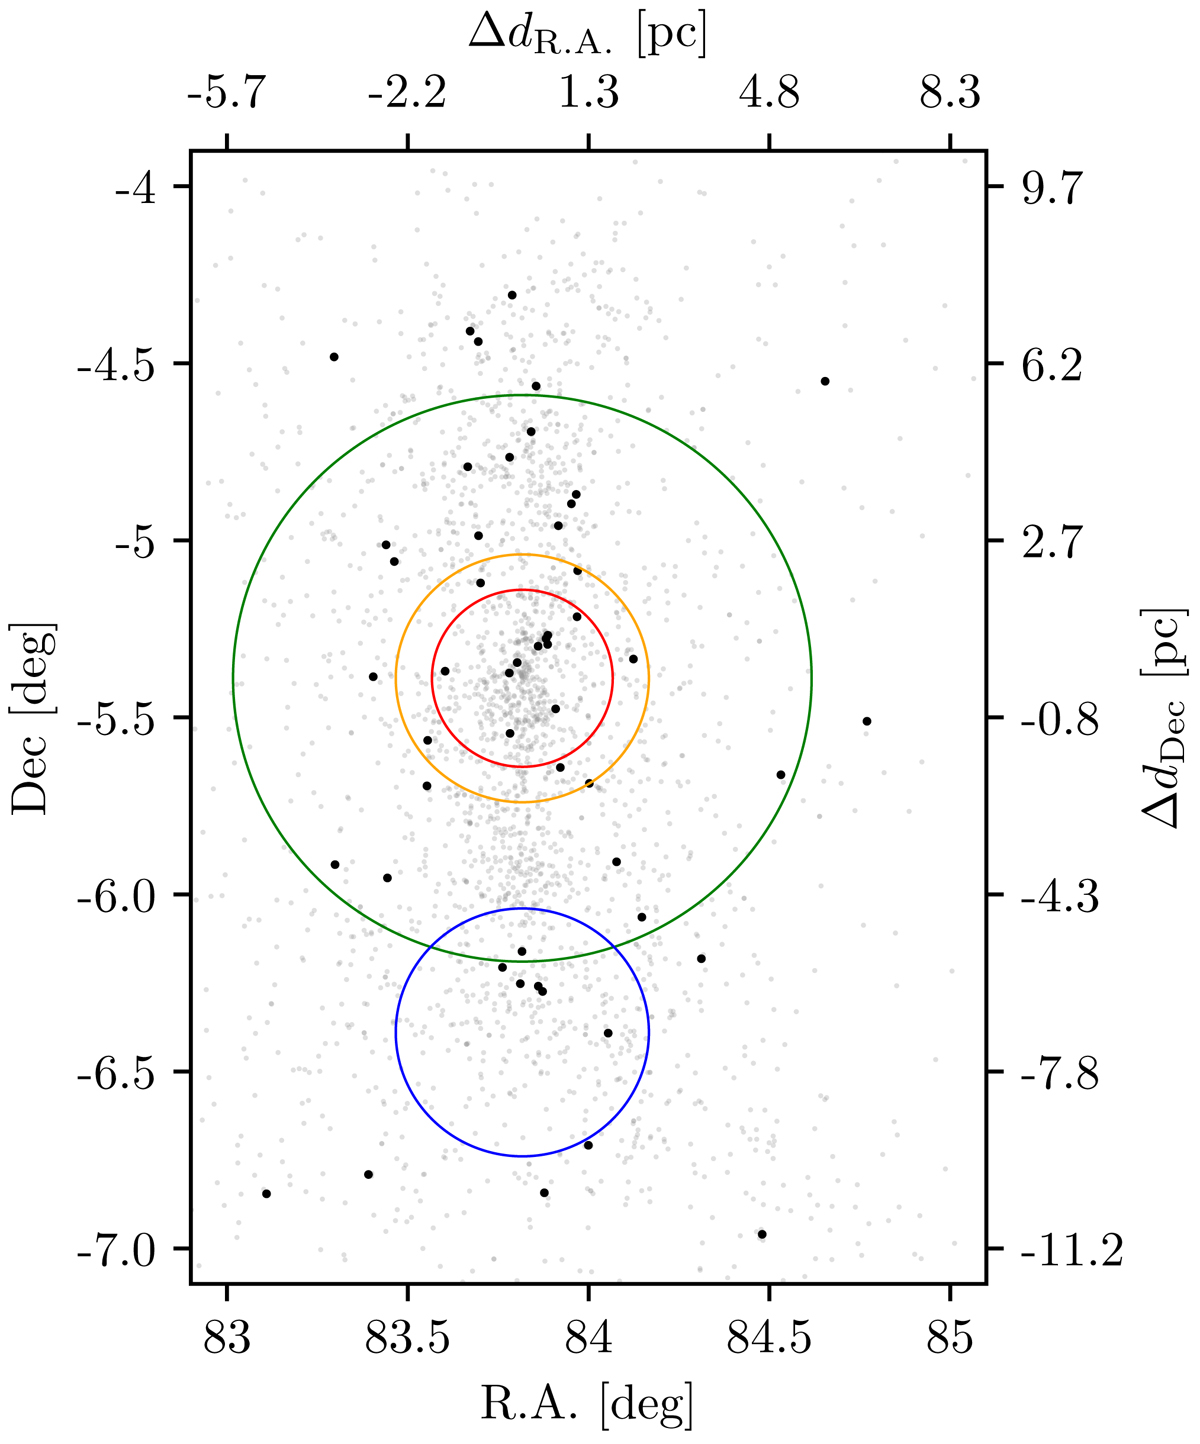
On-the-sky distribution of the wide (on-the-sky component separation between 1000 and 3000 au) binaries. Only one component of the binary star candidates is plotted. The red circle shows the region, 15 arcmin = 0.25 deg, investigated by Scally et al. (1999) who found only four candidates. The orange (radius of 0.35 deg) circle shows the region we selected to test how the Elbow plot depends on the investigated spatial scale. The green circle is the (1 deg) large testing region and the blue circle (radius 0.35 deg) is outside where the stellar density is lower.
Current usage metrics show cumulative count of Article Views (full-text article views including HTML views, PDF and ePub downloads, according to the available data) and Abstracts Views on Vision4Press platform.
Data correspond to usage on the plateform after 2015. The current usage metrics is available 48-96 hours after online publication and is updated daily on week days.
Initial download of the metrics may take a while.