Fig. 7.
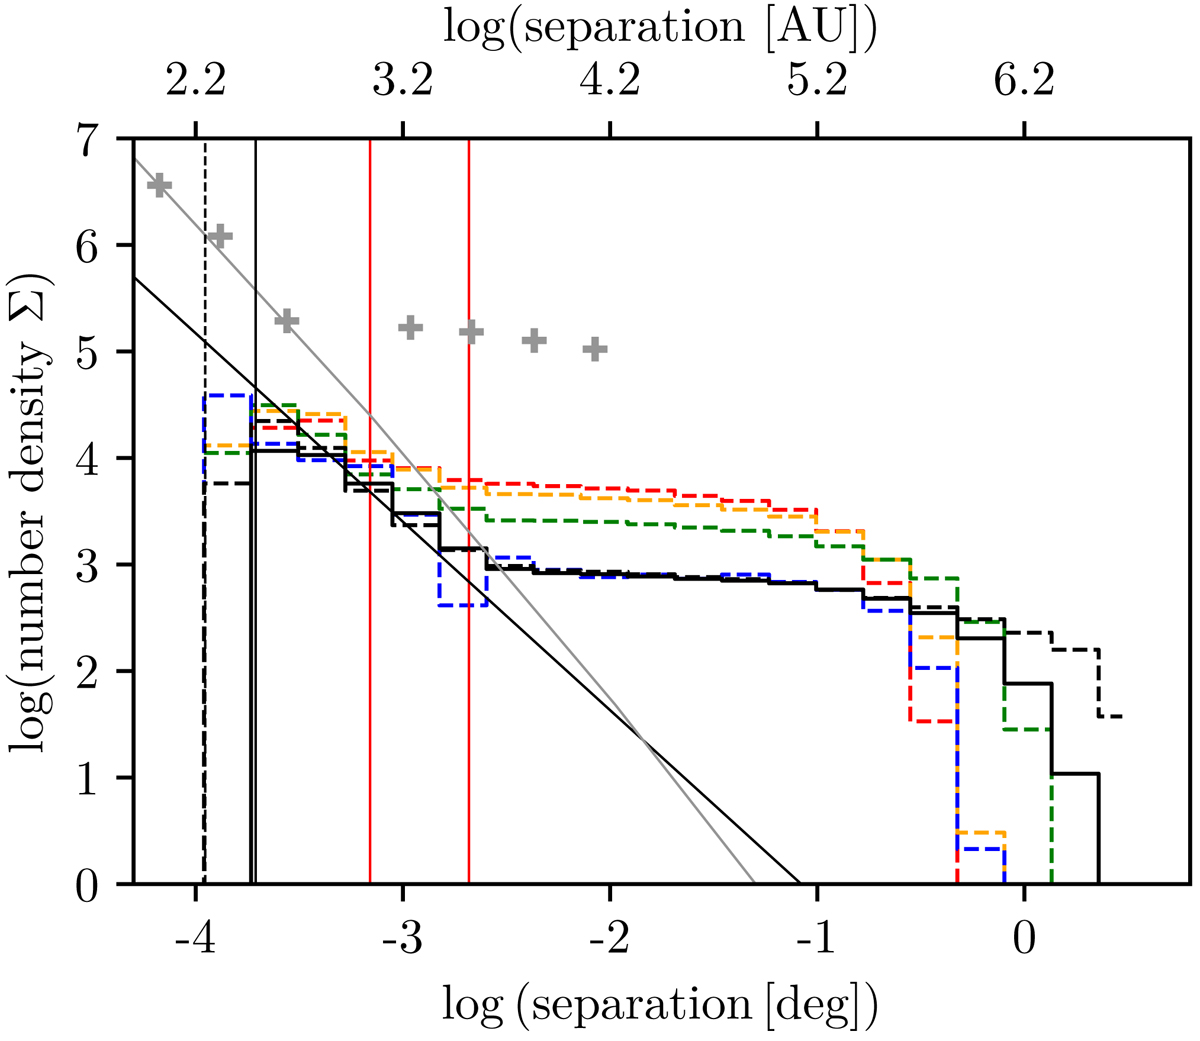
Elbow plot showing the surface number density as a function of separation on the sky. The black dashed line shows the original Gaia data sample, the black solid line shows the cross-matched, that is, initial, catalog after the C1 and 2-σC2 are applied. We fit the elbow part of the diagram obtaining a slope value −1.7 ± 0.05. The gray data points and the DM slope are from Simon (1997) having a smaller field of view by using the HST. The gray line is the Duquennoy & Mayor (1991) distribution of binary stars of G-type primaries that has been reformulated to the number density Σ by Gladwin et al. (1999) (their Eq. (5)). The vertical lines (from left to right) are the resolution limit of Gaia DR2, the resolution limit of OmegaCAM, respectively, the first red line shows (1 × 10³ au) as the definition of wide binaries, and the last line shows the start of the Elbow feature (3 × 10³ au). The color histograms are constructed for central circular regions (see Fig. 8) to see how the potential of detection of wide binaries changes with the chosen spatial region.
Current usage metrics show cumulative count of Article Views (full-text article views including HTML views, PDF and ePub downloads, according to the available data) and Abstracts Views on Vision4Press platform.
Data correspond to usage on the plateform after 2015. The current usage metrics is available 48-96 hours after online publication and is updated daily on week days.
Initial download of the metrics may take a while.