Fig. 3.
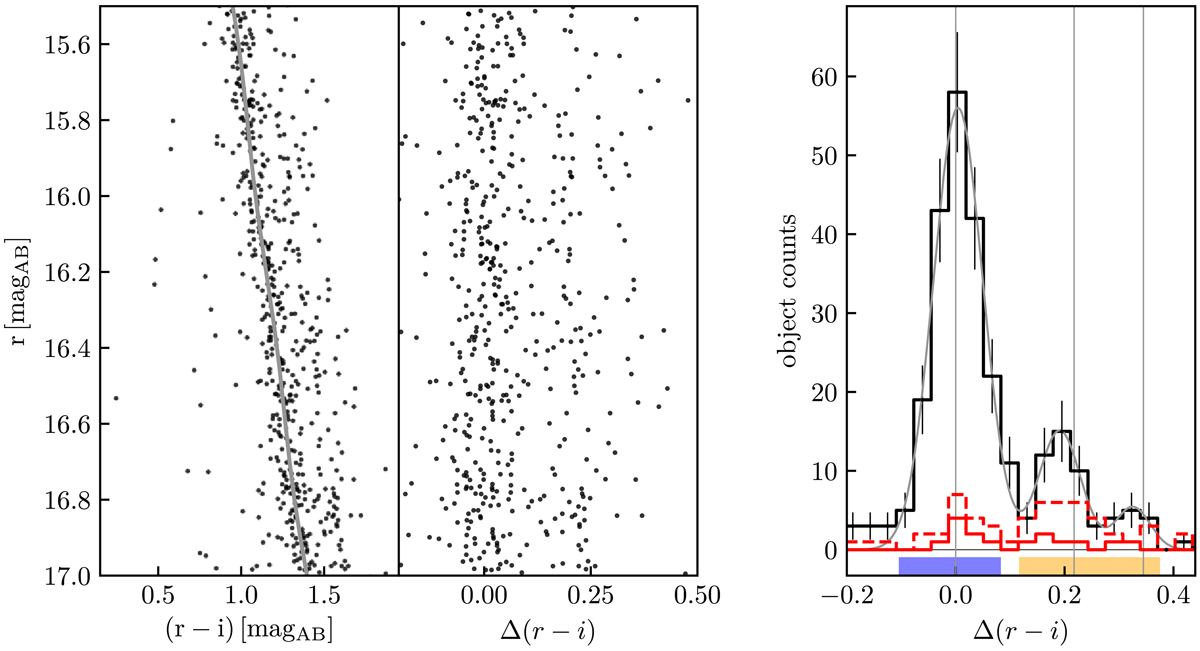
Left panel: CMD of the C1+C2−1σ+C3 selected data sample. The main ridge line is shown as a gray line. Middle panel: CMD rotated along the slope of the main ridge line. Right panel: histograms of the distances in color from the main ridge line. The black solid line corresponds to the data sample after applying all selection criteria (C1, C2 1-σ and C3). The vertical line at Δ(r − i)=0 shows the position of the mean ridge line which serves as a reference line. It also represent the location of the single stars belonging to the main population of the ONC. The two vertical lines Δ(r − i) > 0 indicate the expected positions of the equal mass binary and triple systems, respectively. The red dashed histogram shows the unresolved binary stars from Tobin et al. (2009). The solid-line red histogram shows the distribution of the unresolved binaries that passed the selection criteria (C1, C2 1-σ and C3).
Current usage metrics show cumulative count of Article Views (full-text article views including HTML views, PDF and ePub downloads, according to the available data) and Abstracts Views on Vision4Press platform.
Data correspond to usage on the plateform after 2015. The current usage metrics is available 48-96 hours after online publication and is updated daily on week days.
Initial download of the metrics may take a while.