Fig. A.2.
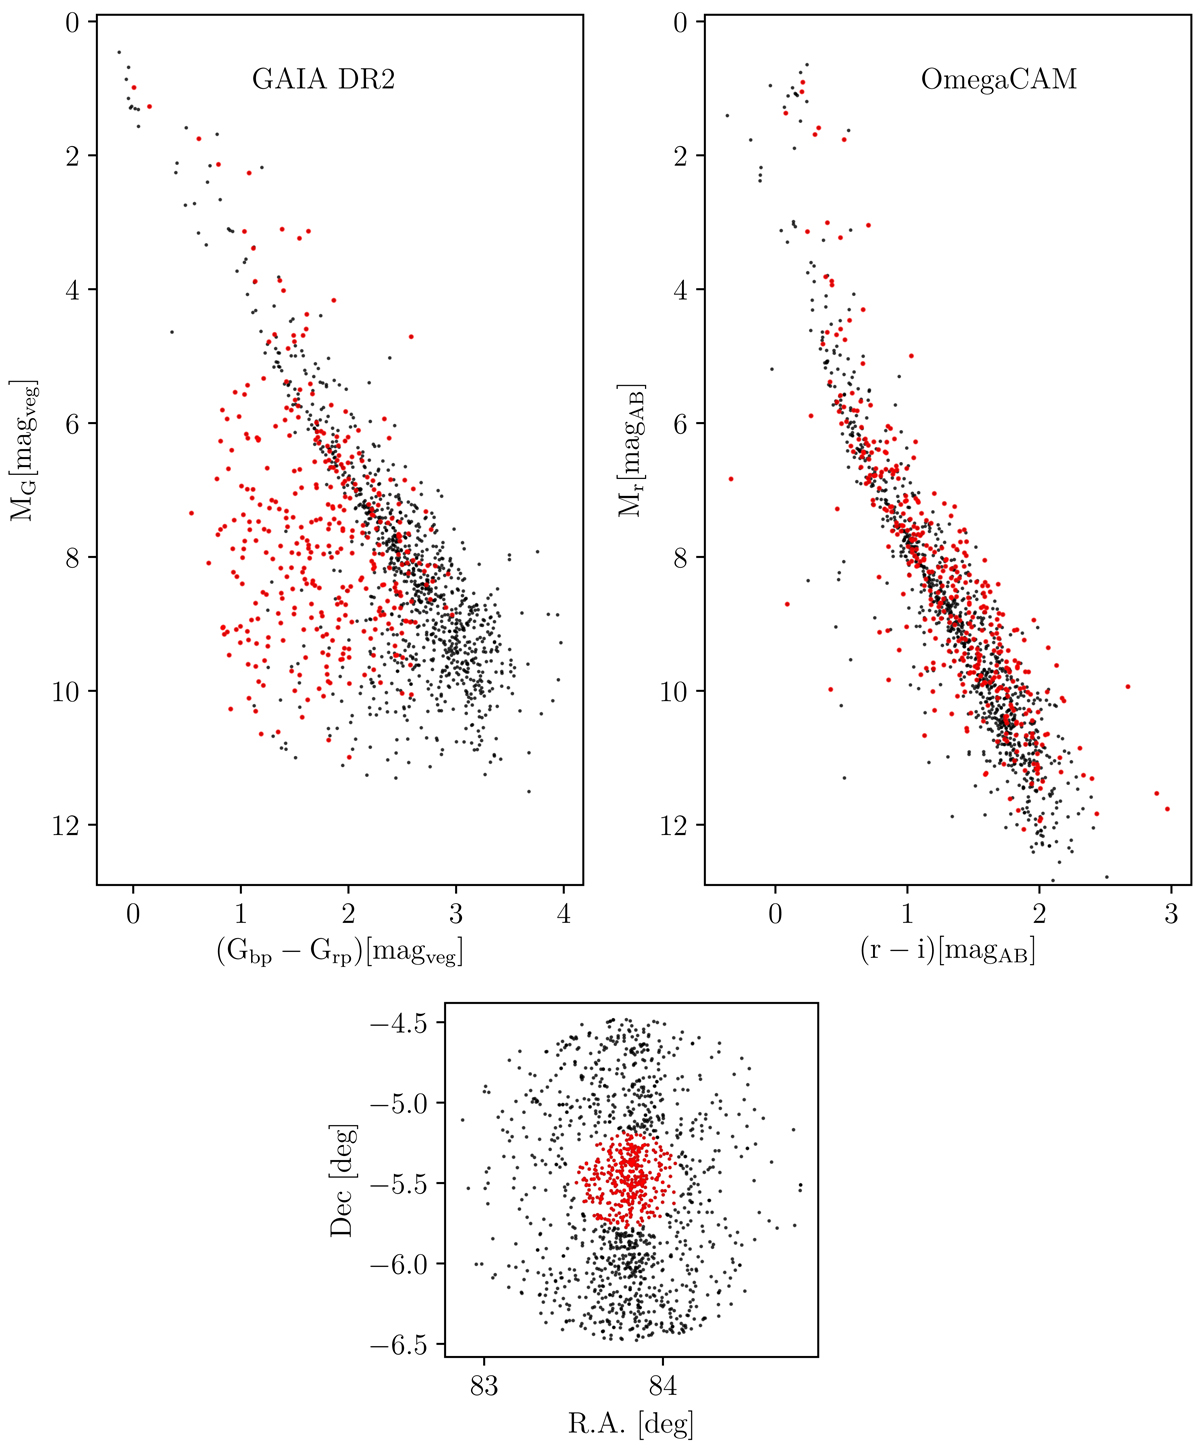
Top panels: CMD using Gaia photometric filters (left) and using OmegaCAM filters (right). The black points show the one-degree region from the ONC center and the red points the inner 0.2° region. Clearly, the Gaia photometry in bp and rp filters is affected by the central crowding. Bottom panel: RA and Dec plot showing the one-degree region and the 0.2° central selection (red points). In all panels, the black points are the C1 and 2-σC2 selected objects.
Current usage metrics show cumulative count of Article Views (full-text article views including HTML views, PDF and ePub downloads, according to the available data) and Abstracts Views on Vision4Press platform.
Data correspond to usage on the plateform after 2015. The current usage metrics is available 48-96 hours after online publication and is updated daily on week days.
Initial download of the metrics may take a while.