Fig. 1.
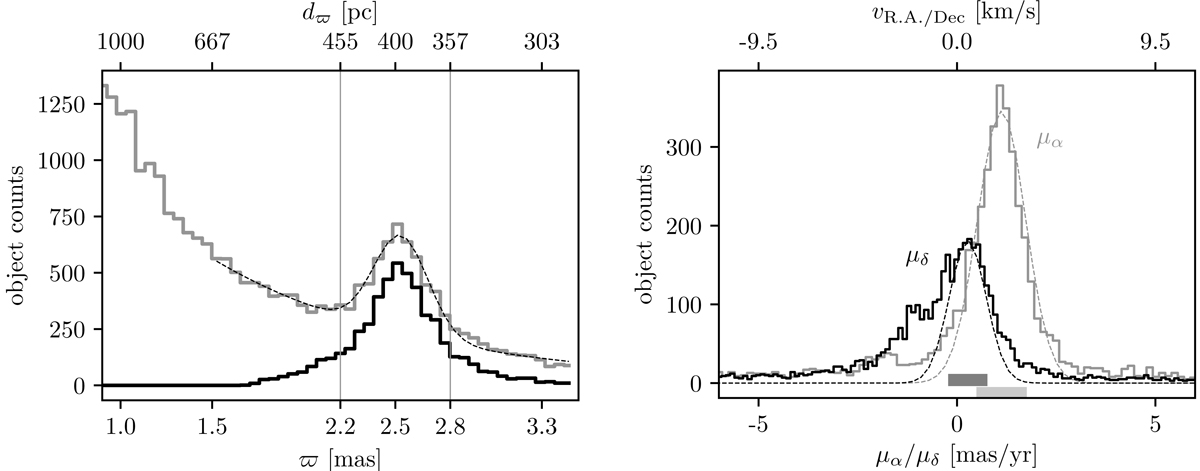
Left panel: distribution of the parallax, ϖ, of all the objects in the initial catalog (gray histogram) and the bona fide ONC members selected with C1 (black histogram; see Sect. 3). The dashed line show the Gaussian fit to the distribution of parallaxes of the stars in the initial catalog. The vertical line indicates the ±2σ distance from the peak of the distribution at ≈2.52. The top horizontal axis shows corresponding values, d, in parsecs using d [pc] = 1/(ϖ [mas] × 10−3), valid for those objects that have small relative errors (Gaia Collaboration 2018). Right panel: distributions of the RA and Dec proper motions (gray and black histograms, respectively). To select the objects that have proper motions consistent with the bulk of the ONC we fit each distribution with a Gaussian function shown by dashed lines. The gray horizontal bars indicate the 1σ range of the respective fit. The top axis shows the values of the proper motions in km s−1, calculated assuming a distance of 400 pc.
Current usage metrics show cumulative count of Article Views (full-text article views including HTML views, PDF and ePub downloads, according to the available data) and Abstracts Views on Vision4Press platform.
Data correspond to usage on the plateform after 2015. The current usage metrics is available 48-96 hours after online publication and is updated daily on week days.
Initial download of the metrics may take a while.