Fig. 8.
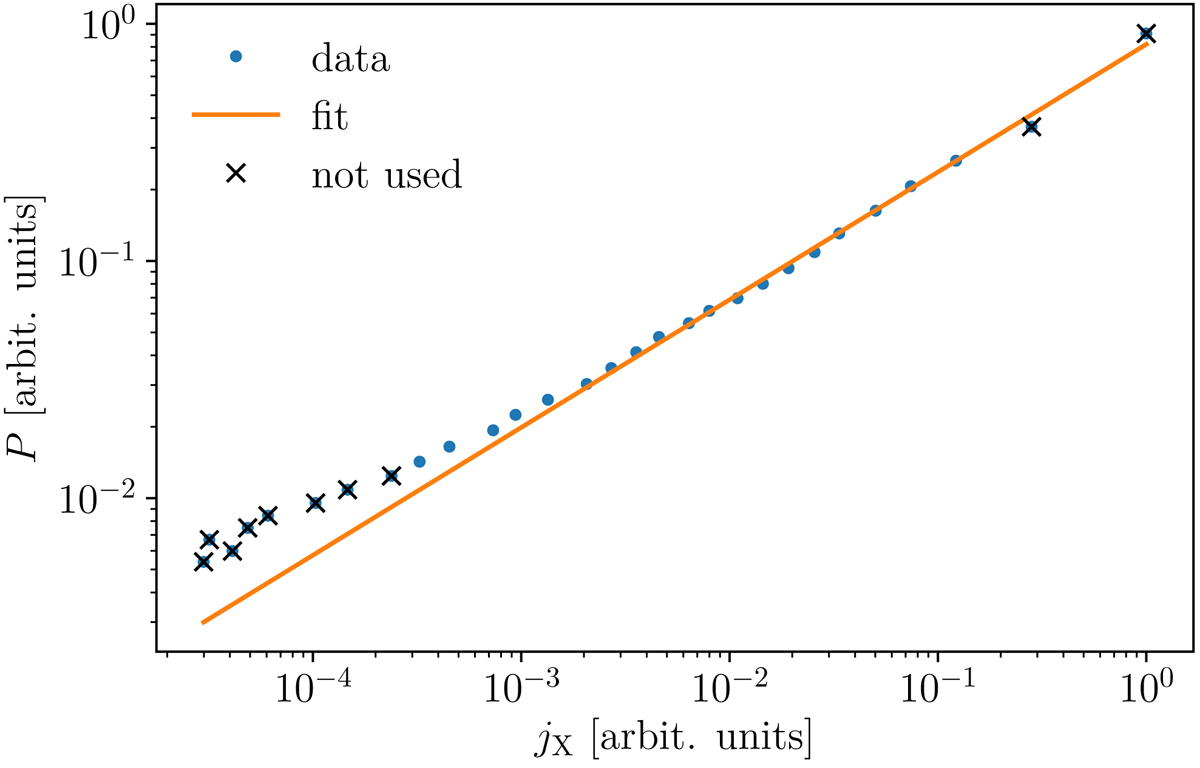
Pressure vs. emissivity in the realistic cluster. The data show a broken power law behaviour indicating that the simple assumptions going into our method are not valid throughout. We restrict the analysis and the fit to obtain the polytropic index to the radial region where the P − jX follows a straight line in double-logarithmic scaling.
Current usage metrics show cumulative count of Article Views (full-text article views including HTML views, PDF and ePub downloads, according to the available data) and Abstracts Views on Vision4Press platform.
Data correspond to usage on the plateform after 2015. The current usage metrics is available 48-96 hours after online publication and is updated daily on week days.
Initial download of the metrics may take a while.