Fig. 6
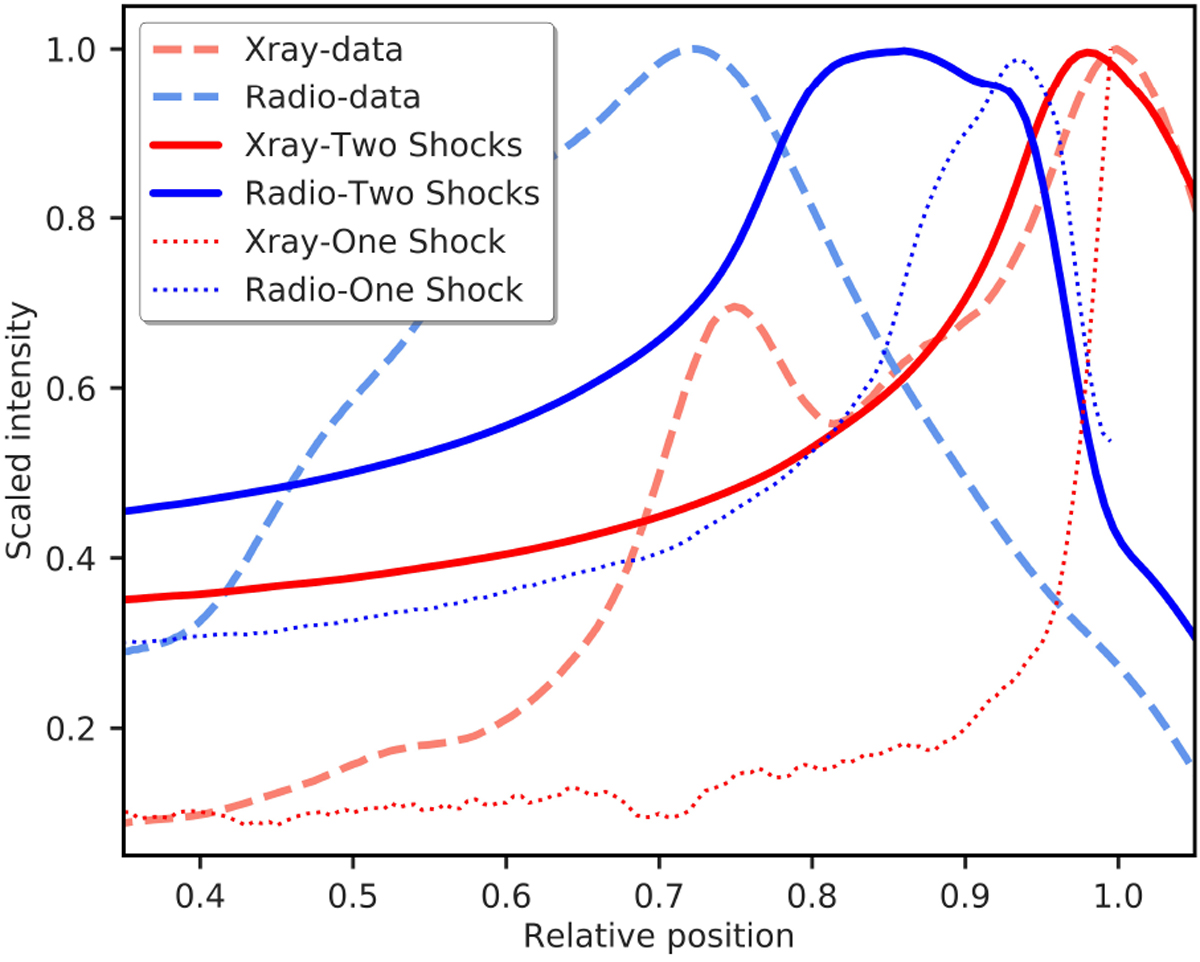
Morphology of the remnant in X-rays and the radio band. The X-ray data are taken from Borkowski et al. (2017) and the radio-data are from Luken et al. (in prep.). The dashed lines indicate the intensity integrated in a rectangular region in the N-S direction covering the X-ray ears and projected onto the E-W axis. A similar method was applied to the theoretical data.
Current usage metrics show cumulative count of Article Views (full-text article views including HTML views, PDF and ePub downloads, according to the available data) and Abstracts Views on Vision4Press platform.
Data correspond to usage on the plateform after 2015. The current usage metrics is available 48-96 hours after online publication and is updated daily on week days.
Initial download of the metrics may take a while.