Fig. 3
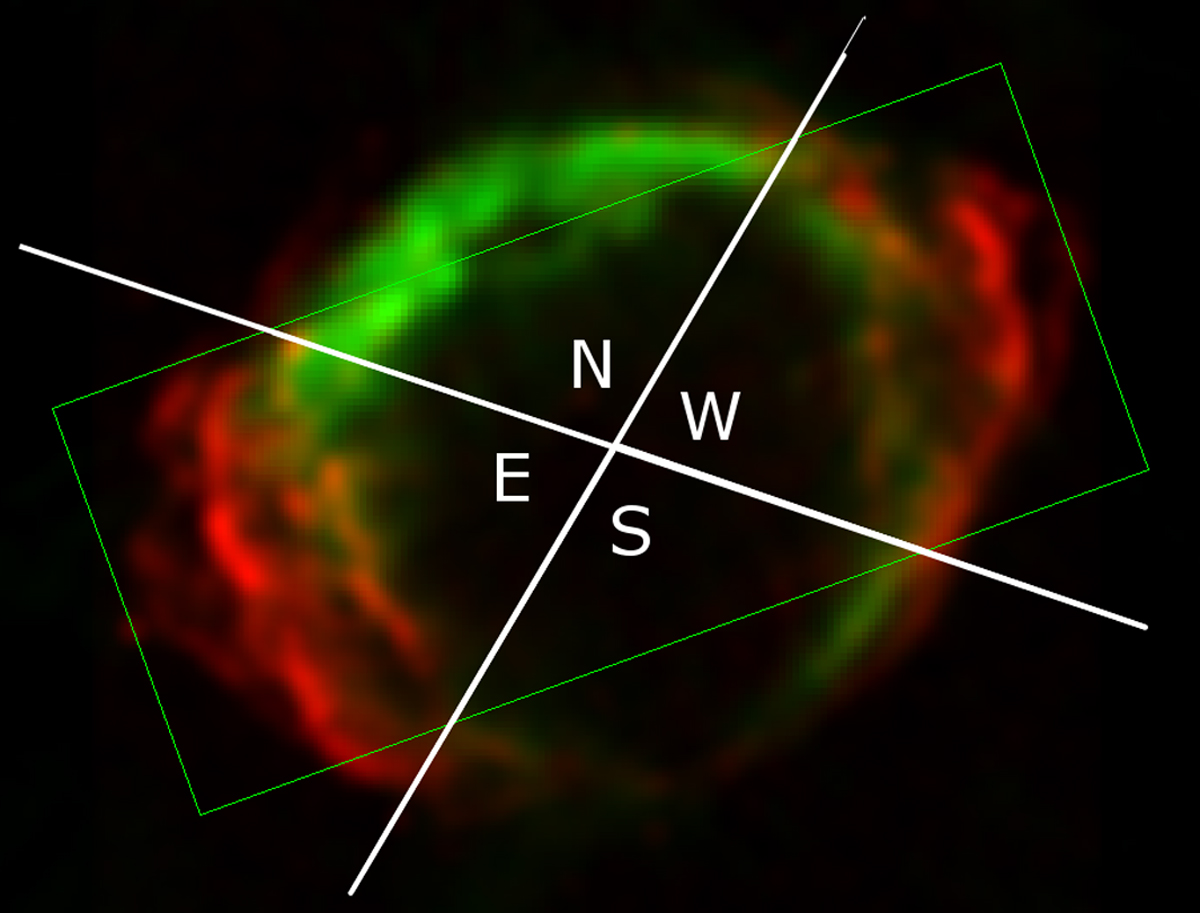
Composite image of X-ray (red, Borkowski et al. 2017) and radio (green, Luken et al., in prep.) observations of G1.9+0.3, both from 2017. The green box marks the region from which we extracted the emission profiles. The bulk of the X-ray emission is concentrated in the E and W cones. The radio emission is brightest in the N and dimmer in the S.
Current usage metrics show cumulative count of Article Views (full-text article views including HTML views, PDF and ePub downloads, according to the available data) and Abstracts Views on Vision4Press platform.
Data correspond to usage on the plateform after 2015. The current usage metrics is available 48-96 hours after online publication and is updated daily on week days.
Initial download of the metrics may take a while.