Fig. 3.
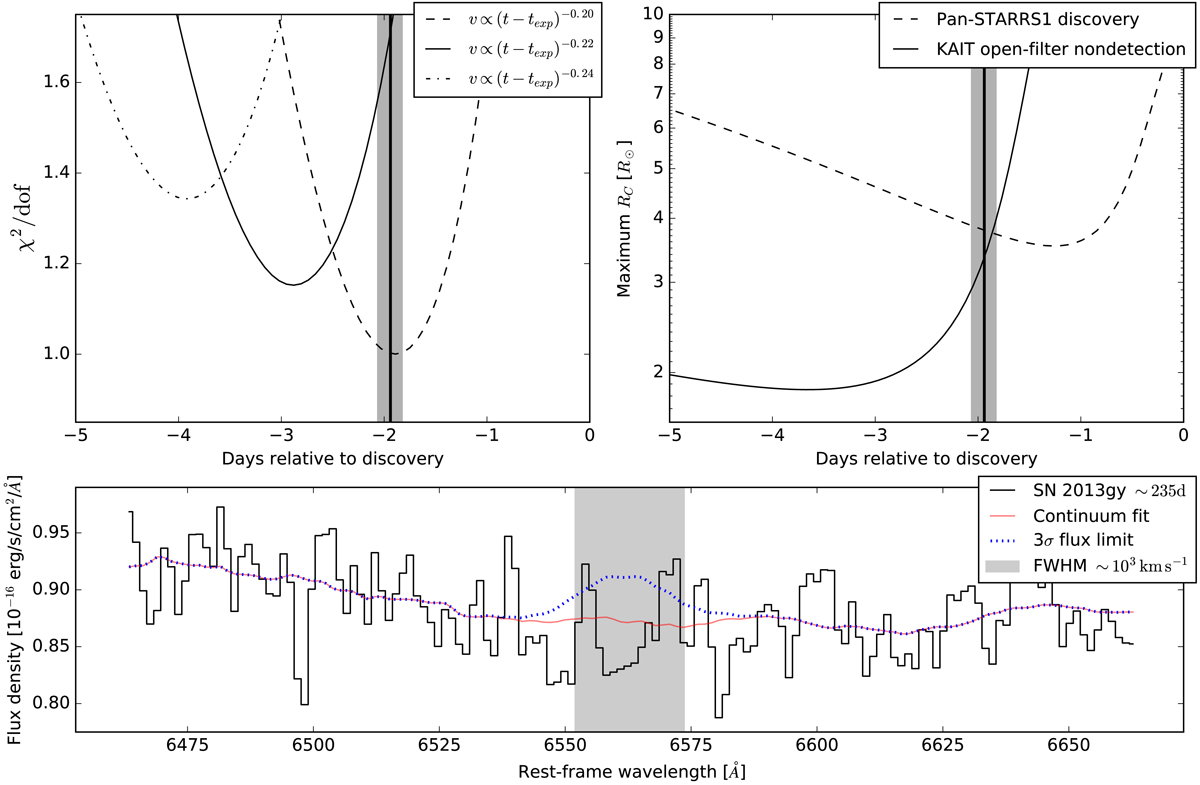
Left: estimate of texplosion based upon functional fits to the velocity evolution of Si IIλ6355. Right: maximum allowed radius of a companion star as a function of explosion time as inferred from the discovery gPS1 photometry and the previous KAIT nondetection limit plotted vs. days since discovery. The vertical black line in the left and right panels corresponds to the best-fit tfirst, accompanied by a shaded gray region corresponding to its 1σ uncertainty. Bottom: rest-frame-corrected nebular spectrum of SN 2013gy (black line), the continuum fit (red), and our 3σ Hα flux limit (blue line). The shaded area extends over the expected location of Hα ± 1000 km s−1.
Current usage metrics show cumulative count of Article Views (full-text article views including HTML views, PDF and ePub downloads, according to the available data) and Abstracts Views on Vision4Press platform.
Data correspond to usage on the plateform after 2015. The current usage metrics is available 48-96 hours after online publication and is updated daily on week days.
Initial download of the metrics may take a while.