Fig. 2.
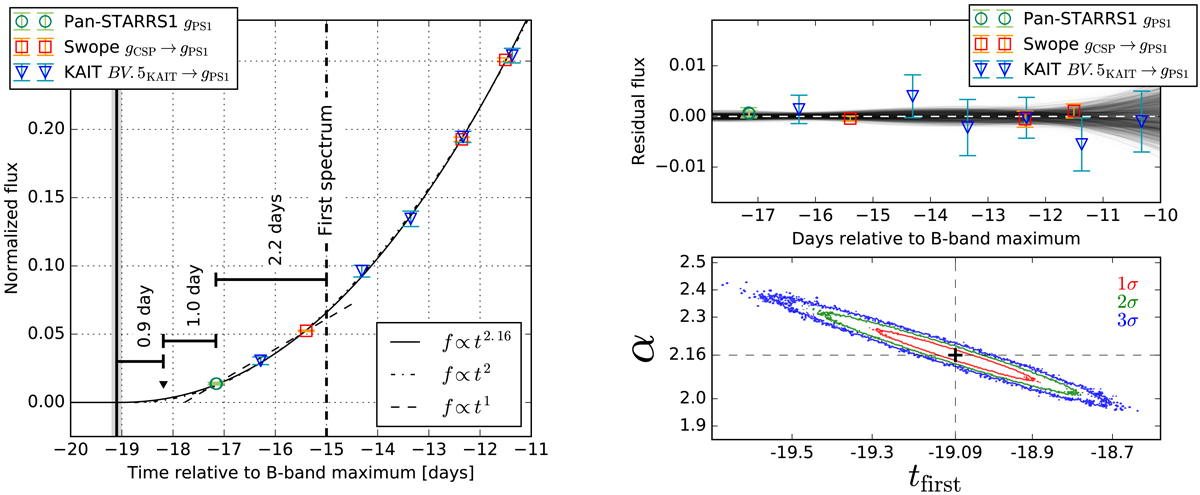
Left: early-time gPS1-band light curve of SN 2013gy based on photometry measured from PS1, CSP-II, and KAIT images, plotted along with the best-fit, single power-law function characterized by an index α = 2.16 (solid curve), the “fireball” model (α = 2, dash-dot curve), and a linear rise for the first ∼3 d (dashed curve). The KAIT open-filter nondetection obtained 1 d prior to discovery is plotted as a black filled triangle. The solid vertical black line indicates tfirst with its width corresponding to the 1σ uncertainty (gray region), and the vertical dashed line corresponds to the epoch of the first spectrum. Right, top: residuals between the best-fit model and the data (horizontal dashed white line); black lines correspond to models sampled from below (right, bottom panel), which contains 1σ, 2σ, and 3σ error ellipses indicating the uncertainties in the model fit parameters α and tfirst.
Current usage metrics show cumulative count of Article Views (full-text article views including HTML views, PDF and ePub downloads, according to the available data) and Abstracts Views on Vision4Press platform.
Data correspond to usage on the plateform after 2015. The current usage metrics is available 48-96 hours after online publication and is updated daily on week days.
Initial download of the metrics may take a while.