Fig. 1.
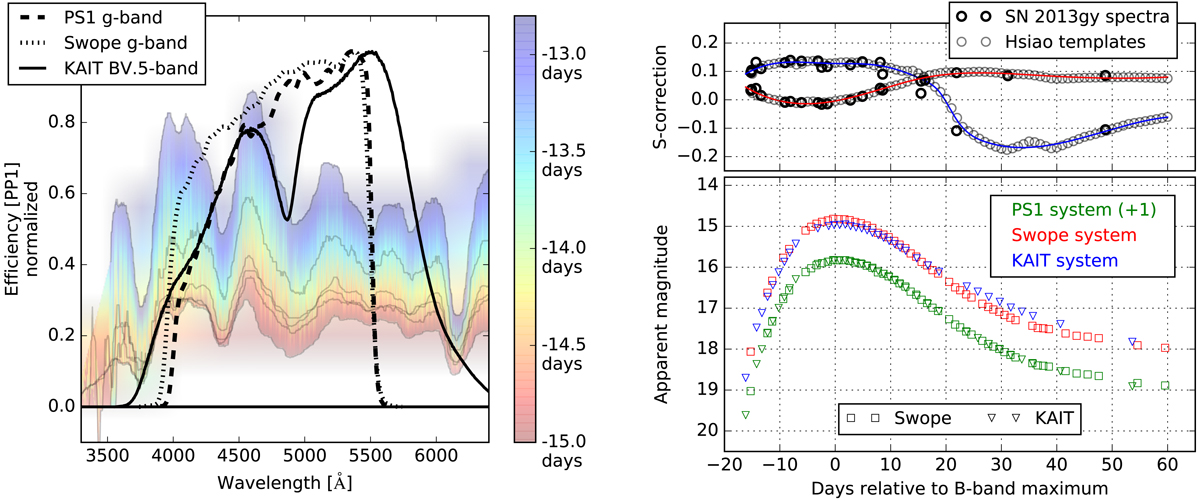
System response functions and S-correction results. Left: comparison of the normalized gPS1 (dashed line), the gCSP (dotted line), and BV.5 (solid line) system response functions. Also plotted are seven visual-wavelength spectra of SN 2013gy ranging between −16.1 d and −13.4 d as indicated by the color bar. Right, top panel: S-corrections as a function of phase using observed (dark circles) spectra and Hsiao et al. (2007) template spectra (light circles). The smoothing splines of those S-corrections (red and blue lines for gCSP and BV.5, respectively) enable us to accurately transform gCSP-band and BV.5-band natural-system photometry to the gPS1 natural system at any phase. Right, bottom panel: gCSP- (red squares) and BV.5-band (blue triangles) natural-system photometry, and the S-corrected versions (green squares and green triangles) transformed to the gPS1 natural system (offset by +1 mag).
Current usage metrics show cumulative count of Article Views (full-text article views including HTML views, PDF and ePub downloads, according to the available data) and Abstracts Views on Vision4Press platform.
Data correspond to usage on the plateform after 2015. The current usage metrics is available 48-96 hours after online publication and is updated daily on week days.
Initial download of the metrics may take a while.