| Issue |
A&A
Volume 626, June 2019
|
|
|---|---|---|
| Article Number | A130 | |
| Number of page(s) | 8 | |
| Section | Extragalactic astronomy | |
| DOI | https://doi.org/10.1051/0004-6361/201935483 | |
| Published online | 24 June 2019 | |
Near- to mid-infrared spectroscopy of the heavily obscured AGN LEDA 1712304 with AKARI/IRC
1
Graduate School of Science, Nagoya University, Furo-cho, Chikusa-ku, Nagoya, Aichi 464-8602, Japan
e-mail: tsuchikawa@u.phys.nagoya-u.ac.jp
2
Institute of Space and Astronautical Science, Japan Aerospace Exploration Agency, 3-1-1 Yoshinodai, Chuo-ku, Sagamihara, Kanagawa 252-5210, Japan
3
Department of Astronomy, Kyoto University, Kitashirakawa-Oiwake-cho, Sakyo-ku, Kyoto 606-8502, Japan
4
Academia Sinica Institute of Astronomy and Astrophysics, 11F of Astronomy-Mathematics Building, AS/NTU, No.1, Section 4, Roosevelt Road, Taipei 10617, Taiwan
5
Research Center for Space and Cosmic Evolution, Ehime University, 2-5 Bunkyo-cho, Matsuyama, Ehime 790-8577, Japan
Received:
18
March
2019
Accepted:
5
May
2019
Context. Although heavily obscured active galactic nuclei (AGNs) have been found by many observational studies, the properties of the surrounding dust are poorly understood. Using AKARI/IRC spectroscopy, we discovered a new heavily obscured AGN in LEDA 1712304 which shows a deep spectral absorption feature due to silicate dust.
Aims. We study the infrared (IR) spectral properties of circumnuclear silicate dust in LEDA 1712304.
Methods. We performed IR spectral fitting, considering silicate dust properties such as composition, porosity, size, and crystallinity. Spectral energy distribution fitting was also performed on the flux densities in the UV to submillimeter range to investigate the global spectral properties.
Results. The best-fit model indicates 0.1 μm-sized porous amorphous olivine (Mg2xFe2−2xSiO4; x = 0.4) with 4% crystalline pyroxene. The optical depth is τsil ∼ 2.3, while the total IR luminosity and stellar mass are estimated to be LIR = (5 ± 1)×1010 L⊙ and Mstar = (2.7 ± 0.8)×109 M⊙, respectively. In such low LIR and Mstar ranges, there are few galaxies that show such a large τsil.
Conclusion. The silicate dust in the AGN torus of LEDA 1712304 has properties that are notably similar to those in other AGNs overall, but slightly different in the wing shape of the absorption profile. The porosity of the silicate dust suggests dust coagulation or processing in the circumnuclear environments, while the crystallinity suggests that the silicate dust is relatively fresh.
Key words: infrared: galaxies / galaxies: nuclei / galaxies: individual: LEDA 1712304
© ESO 2019
1. Introduction
Dust plays an important role in probing the activity of active galactic nuclei (AGNs). The AGN unified model (e.g., Antonucci 1993; Urry & Padovani 1995) states that a supermassive black hole (SMBH) and its accretion disk are enshrouded by an optically thick dusty torus that has an axisymmetric structure, which explains the difference in the optical line profiles. Heavily obscured AGNs that show almost no optical sign of AGN activities have been found by many observational studies (e.g., Sanders & Mirabel 1996; Lutz et al. 1998; Dey et al. 2008; Imanishi et al. 2008; Oyabu et al. 2011). Due to the presence of thick dust layers around the AGN core, the UV and optical emission from the AGN accretion disk is strongly suppressed, and thus AGN identification on the basis of the optical line ratios encounters difficulty for the heavily obscured AGNs. Infrared (IR) observations can identify AGNs without undergoing severe dust extinction. For heavily obscured AGNs, the near- to mid-IR range is dominated by the hot dust emission heated by AGNs, where the spectra show power-law continua. While the presence of heavily obscured AGNs is suggested in many cases, the properties of the surrounding dust, such as size, chemical composition, and crystallinity, are poorly understood.
The spectroscopy in the near- to mid-IR range, which contains various dust spectral features, is an effective way to understand the properties of dust. In particular, the profiles of the silicate features at around 9.7 μm (Si–O stretching mode) and 18 μm (O–Si–O bending mode) reflect the chemical composition, size distribution, crystallinity, and structure of the silicate dust. The silicate features for nearby luminous IR galaxies (LIRGs) and ultra-luminous IR galaxies (ULIRGs) have been studied extensively by Spitzer/IRS (e.g., Imanishi 2009; Stierwalt et al. 2013). In particular, many U/LIRGs have deep silicate absorption features (e.g., Roche et al. 1986; Spoon et al. 2007) that tend to possess heavily obscured AGNs (e.g., Imanishi 2009) and are likely to be at the late to final stages of the merger (Stierwalt et al. 2013). On the other hand, the depths of the silicate features in AGNs depend on the AGN type; type-1 Seyferts show the features in either emission or weak absorption, while type-2 Seyferts only show those in absorption (Hao et al. 2007). As a global trend, the number of galaxies that have deep silicate absorption features increases with the IR luminosities of their host galaxies (Imanishi 2009). Spoon et al. (2007) suggested that the difference in the silicate absorption depth depends on the circumnuclear distribution of the dusty torus. Roche et al. (2015) reported that the silicate absorption profiles of NGC 4418 showed spectral variations depending on the slit aperture size, which suggests the presence of extended dust emission around the nucleus. Although the main compositions of the features are likely to be amorphous olivine, crystalline silicate substructures are also detected from heavily obscured ULIRG nuclei (Spoon et al. 2006; Stierwalt et al. 2014).
In slit-less spectroscopic surveys using the InfraRed Camera (IRC) on the AKARI satellite (hereafter ARARI/IRC), we serendipitously discovered a galaxy that shows a notably deep silicate absorption feature, but with a relatively low IR luminosity. The galaxy is a local dust-obscured galaxy, LEDA 1712304 (z = 0.0645; Hwang et al. 2013). A galaxy classification of LEDA 1712304 based on the optical line ratios is “undetermined” (Hwang et al. 2013), which indicates that the dust extinction in the galaxy is too large to detect optical lines such as [OIII] 5007. On the other hand, the galaxy is expected to possess an AGN hidden in the galactic center based on the result of IR spectral energy distribution (SED) fitting (Hwang et al. 2013). In this paper, we study the spectral properties of silicate dust in LEDA 1712304, using AKARI/IRC spectroscopic data, as well as the photometric data in the UV to submillimeter range. Throughout the paper we adopt 289.7 Mpc for the distance to the galaxy, assuming the cosmological parameters H0 = 70 km s−1 Mpc−1, ΩΛ = 0.7, and Ωm = 0.3.
2. Observations
2.1. AKARI IR spectroscopy
LEDA 1712304 was detected serendipitously within the field of view of slit-less spectroscopy at 2.5–12.5 μm using the IRC (Onaka et al. 2007) on board the AKARI satellite (Murakami et al. 2007), whose mid-IR spectrum is found in the catalog of Yamagishi et al. (2019). The primary target was IC 860 and the observation was carried out on July 28, 2007, with the IRC spectroscopic mode of the astronomical observation template 04 (AOT04) in the framework of the mission program AGNUL (Evolution of ULIRGs and AGNs; PI: T. Nakagawa). In this study, the near-IR spectrum is combined with the mid-IR spectra to create the 2.5–12.5 μm of LEDA 1712304, where three spectroscopic modules were used; the NIR prism (NP) and the two MIR-S grisms (SG1, SG2) covering the wavelength ranges of 1.8–5.5 μm, 4.6–9.2 μm, and 7.2–13.4 μm, respectively. The wavelength resolution, R(= λ/δλ), is typically 19 at 3.5 μm, 53 at 6.6 μm, and 50 at 10.6 μm for NP, SG1, and SG2, respectively (Ohyama et al. 2007). Since LEDA 1712304 was observed with the slit-less spectroscopy, the spectrum does not need to be corrected for the slit loss. The spectra are processed with a data reduction package: IRC Spectroscopy Toolkit Version 20181203. To extract the spectrum, we applied the aperture sizes of 5 pixels (7.3″), 7 pixels (16.4″), and 7 pixels (16.4″) for NP, SG1, and SG2, respectively. The NP and SG spectra were calibrated on the basis of the AKARI 3.2 μm and 9 μm photometric flux densities, respectively. We did not use the spectral regions of 2.0–2.5 μm and 5.0–5.5 μm, which correspond to the edges of the NP spectral coverage, since systematic errors are relatively large in those regions.
2.2. Multiwavelength photometric data
In order to investigate the global spectral properties of LEDA 1712304, we conducted aperture photometry of the multiwavelength image data taken not only with AKARI, but also with Spitzer (Fazio et al. 2004; Rieke et al. 2004) and Herschel (Poglitsch et al. 2010; Griffin et al. 2010). The Spitzer and Herschel image data were retrieved from the Spitzer Heritage Archive through the NASA/IPAC IR Science Archive (IRSA) and the ESA Herschel science archive, respectively. We applied photometric apertures, Rap, in Table 1, and sky backgrounds were determined in the annuli of inner radii 1.2Rap and outer radii 2Rap. We also applied appropriate aperture corrections to the photometric results as mentioned in each of the handbooks. Table 1 summarizes the results of the aperture photometry. LEDA 1712304 was not detected in the Herschel 160 μm band with the signal-to-noise ratio (S/N) > 3.
Summary of the aperture radii used for the photometry and the flux densities.
We also observed LEDA 1712304 with the Simultaneous Infrared Imager for Unbiased Survey (SIRIUS; Nagashima et al. 1999; Nagayama et al. 2003) on the Infrared Survey Facility (IRSF) at the South African Astronomical Observatory. SIRIUS has a large field of view (7′×7′) and enables simultaneous imaging in the J, H, and Ks bands. The observation was performed on June 6, 2018, and the total integration time was 16.7 minutes. We performed the flux calibration on the basis of the 2MASS Point Source Catalog (Cutri et al. 2003). In addition, we also used the flux densities of LEDA 1712304 taken from the UV, optical and IR catalogs (Hwang et al. 2013; Cutri et al. 2013; Yamagishi et al. 2019).
3. Results
3.1. IR spectral properties
Figure 1 shows the AKARI/IRC 2.5–12.5 μm spectrum of LEDA 1712304. We detect a deep, broad absorption feature due to silicate grains at around 10 μm. We also detect CO ro-vibrational absorption features at around 4.7 μm. Any other spectral features, such as those due to CO2 ice at 4.27 μm, H2O ice at 3.05 and 6.02 μm, and polycyclic aromatic hydrocarbon (PAH) features at 3.3, 6.2, 7.7, and 11.3 μm, are not detected significantly. The spectrum also shows a steep near- to mid-IR slope, which is likely to indicate that the continuum is dominated by thermal emission of hot dust heated by AGN. According to the AKARI near-IR AGN diagnostics in Inami et al. (2018), LEDA 1712304 is indeed classified as AGN-dominated galaxy; for AGNs, the near-IR flux density ratio, Fν(4.3 μm)/Fν(2.8 μm), and the equivalent width of the PAH 3.3 μm feature, EW(PAH3.3μm), are expected to be > 1.0 and < 0.06 μm, respectively, while for LEDA 1712304 Fν(4.3 μm)/Fν(2.8 μm) and the 3σ upper limit of EW(PAH3.3μm) are 7.5 ± 0.9 and 0.03 μm, respectively, which is estimated by a Gaussian function with a local power-law continuum.
We evaluate the spectral properties through model fitting to the 2.5–12.5 μm spectrum. In previous studies with similar AGN modeling, Sani et al. (2008), among others, used a steep power-law continuum to reproduce a 3–5 μm spectrum, while Armus et al. (2007) used a hot-temperature blackbody with a cooler amorphous silicate absorption feature for a spectral range similar to ours. Referring to the latter, in reproducing the hot dust continuum and the deep spectral absorption feature we assume a two-layer configuration for a dusty AGN torus, which is composed of a hot emitting inner layer and a warm absorbing outer layer. The hot emitting inner layer represents an optically thick hot dust layer that enshrouds the AGN core, while the warm absorbing outer layer represents a warm dust layer enveloping the hot inner layer. Hence the fitting function is described as

where Ndust, a, Qabs, ν, τCO, and Bν(Th) are the column density, the size, the absorption efficiency of silicate dust in the outer layer, the optical depth of the CO absorption feature, and the Planck function at temperature Th of the hot dust emission from the optically thick inner layer, respectively. The dust size, a, is fixed at 0.1 μm, unless otherwise stated. For the CO gas absorption profile, we adopted a Gaussian function, the center of which was fixed at 4.67 μm.
As a first step, we assume the standard astronomical silicate (Draine 2003b) for the composition of dust in the absorbing outer layer. The fitted model is shown by a black line in the bottom panel of Fig. 1, while the fitting result is summarized in Table 2. We find that the standard astronomical silicate model does not reproduce the observed silicate absorption feature at all; the observed peak and the feature profile are considerably different from those predicted by the model (see bottom panel of Fig. 1). In principle, the peak of the model feature can be shifted toward longer wavelengths by changing either the size or porosity of silicate dust (Laor & Draine 1993; Li et al. 2008). However, we find that the feature profile of larger size or porous astronomical silicate model then becomes too wide to reproduce the observed spectrum.
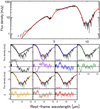 |
Fig. 1. Top panel: AKARI/IRC spectrum of LEDA 1712304 shown together with the best-fit model (model 7; red solid line). Bottom panel: close-up view of the fitting results of the 10 μm silicate absorption feature with various spectral models and the residuals normalized by the errors. Black, purple, blue, green, orange, brown and red solid lines show the astronomical silicate (model 1), amorphous olivine (Mg2xFe2−2xSiO4, x = 0.5; model 2), amorphous olivine (x = 0.4; model 3), a combination of the amorphous olivine (x = 0.5) absorption and absorption-free emission component (model 4), the porous amorphous olivine (x = 0.4; model 5), the 1 μm-sized amorphous olivine (x = 0.4; model 6) and a mixture of the porous amorphous olivine (x = 0.4) and the crystalline pyroxene (model 7), respectively. |
Summary of the results of the IR spectral fitting with various silicate dust models.
It is known that silicate features closely fit the composition of amorphous olivine (Mg2xFe2−2xSiO4; x = 0.5) rather than the astronomical silicate for heavily obscured AGNs and Galactic center sources (Spoon et al. 2006; Kemper et al. 2004). Hence, we test two kinds of models of amorphous olivine (Mg2xFe2−2xSiO4; x = 0.5 and 0.4 for models 2 and 3, respectively; Dorschner et al. 1995). The fitting results are listed in Table 2; they show that model 3 fits the spectrum better than model 2. The best-fit models of amorphous olivine (x = 0.5 and x = 0.4) are also shown in the bottom panel of Fig. 1, where we find that the feature profile is still not reproduced well by either model, although the peak wavelengths show better fits to the spectrum compared to model 1.
Model 2 does not fit the spectrum very well at the bottom of the profile, while model 3 reproduces the bottom of the profile fairly well. In order to improve the former discrepancy, we add an absorption-free hot dust emission component in the model, which raises the floor level of the feature, as pointed out by Spoon et al. (2004). Thus, the fitting function of Eq. (1) is modified as follows:

The result of the spectral fitting is shown by a green line in the bottom panel of Fig. 1 (model 4) and also in Table 2, where we find that model 4 improves the fit around the bottom of the profile and yet the fit is still not acceptable on the basis of the χ2 statistics. In particular, model 4 fails to reproduce the wing of the profile on the shorter wavelength side.
On the other hand, since model 3 predicts a feature profile that is narrower than the observed absorption feature, we change the porosity and size of amorphous olivine (x = 0.4) to widen the feature profile of model 3. We calculate the absorption efficiency of porous dust, averaging dielectric functions according to the Maxwell Garnett theory (Bohren & Huffman 1983). Assuming that the porosity of amorphous olivine (x = 0.4) is 30%, which is a volume fraction of the vacuum in a dust grain, we improve the fit to the silicate feature significantly (model 5; see the orange line in Fig. 1), except for the residual seen at around 9.3 μm. We also test a large-size silicate model (model 6), assuming 1 μm-sized amorphous olivine (x = 0.4), instead of the porous amorphous olivine. We find, however, that the fit is only slightly improved from model 3 to model 6, and thus we conclude that the higher porosity is more favorable than the larger sizes for silicate grains.
Even with model 5, we find that there are systematic residuals at around 9.3μm, which significantly degrade the fit near the bottom of the absorption profile. Therefore, we add a crystalline pyroxene component (Jaeger et al. 1994) to the porous amorphous olivine component. Hence, model 7 is a mixture of the porous amorphous olivine (x = 0.4) and crystalline pyroxene, which results in the best fit among the silicate models we tested (see in Table 2).
3.2. Multiwavelength photometric properties
Figure 2 shows the SED of LEDA 1712304, which is created with the flux densities listed in Table 1. We performed spectral decomposition using the four SED components of stellar, hot dust, warm dust, and cold dust emission. We confirm that the photometric flux densities at 2.5–12.5 μm (except that of the WISE 12 μm band because it contains the silicate feature) are consistent with the AKARI/IRC spectrum. We used the AKARI/IRC spectrum as well as the near- to mid-IR flux densities except the WISE 12 μm flux density for the SED fitting. As can be seen in Fig. 2, the SED shows that the UV to near-IR continuum is dominated by notably red stellar emission. Hence, in the SED fitting, we apply a stellar continuum model for an elliptical galaxy (13 Gyr; Silva et al. 1998) and also take into account the reddening effect, for which the dust extinction law derived in Calzetti et al. (2000) is adopted. Since the near- to mid-IR range is dominated by hot dust emission, we adopt the best-fit silicate model derived from the spectral fitting (model 7) for the hot dust component. In the far-IR range, we find that double-temperature dust emission reproduces the SED fairly well. For the warm and cold dust components, we assume modified blackbody emission with the emissivity power-law index β = 2.
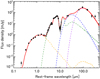 |
Fig. 2. Spectral energy distribution of LEDA 1712304. Filled squares correspond to the observed flux densities, while a downward triangle represents the 3σ upper limit. The AKARI/IRC spectral data at 2.5–12.5 μm are also included in the fitting. A red solid line shows the best-fit model, where the stellar, hot dust, warm dust, and cold dust components are shown by yellow, green, blue, and purple dashed lines, respectively. |
Based on the result of the SED fitting, we derive the stellar mass Mstar, the IR luminosity LIR, and the dust mass Mdust, which are listed in Table 3. The value of Mstar is estimated by assuming the stellar-mass-to-luminosity ratio, Mstar/LKs ∼ 1 (Cole et al. 2001). The value of LIR is calculated to be (5 ± 1)×1010 L⊙ by integrating the best-fit model spectrum over the wavelength range of 8–1000 μm, which is consistent with the lower limit estimated by Hwang et al. (2013, LIR > 3.42 × 10¹⁰L⊙). The warm and cold dust emission is likely to be optically thin in the far-IR range, and we can derive Mdust as
Luminosities and masses of LEDA 1712304 obtained with the SED fitting.
where Fν, D, and κν are the flux density, the distance to the galaxy, and the mass absorption coefficient, respectively. The value of κν is assumed to be proportional to ν2, and we adopt κ140 μm = 13.9 cm2 g−1 (Draine 2003a). We also calculate the optical depth of the silicate feature τsil, following the method defined by Imanishi et al. (2007) where an absorption-free continuum is assumed to be the power-law function determined from the flux densities at 7.1 and 14.2 μm. As a result, τsil is estimated to be 2.3 ± 0.2 at 9.8 μm, the wavelength of the bottom of the absorption feature.
We also performed the SED fitting of the heavily obscured AGN, using the Bayesian SED fitting code CIGALE (Burgarella et al. 2005; Noll et al. 2009; Boquien et al. 2019), which includes energy balance between the dust absorption of the stellar/AGN emission and the dust re-emission in the mid- to far-IR, similarly to the study by Ciesla et al. (2015). As a result, Mstar and LIR are estimated to be 8 × 10⁹ M⊙ and 6 × 10¹⁰ L⊙, respectively. Comparing the result in Table 3, we find that Mstar increases while LIR does not change. The increase in Mstar, however, does not change our conclusion below.
4. Discussion
4.1. Comparison with other AGNs
We detect a deep (τsil ∼ 2.3) absorption feature due to silicate grains at around 10 μm. We compared the optical depth of the silicate feature in LEDA 1712304 with those in other AGNs in a wide range of IR luminosities (1010 L⊙ < LIR < 1013 L⊙). The spectra of the AGNs to be compared are taken from those of the IR galaxies observed by Spitzer/IRS (Stierwalt et al. 2013; Imanishi et al. 2007; Imanishi 2009; Roussel et al. 2006) with the threshold that the equivalent width of the PAH 6.2 μm feature is smaller than 0.27 μm (Stierwalt et al. 2013). In addition, we also take AGNs with low IR luminosities (LIR < 1011 L⊙) from Wu et al. (2010). Figure 3 shows the relation between the IR luminosity and the optical depth of the silicate feature for LEDA 1712304 and the AGNs. We estimated the optical depths of the AGNs of Stierwalt et al. (2013), Wu et al. (2010), and Roussel et al. (2006) by ourselves in the same manner as was performed for LEDA 1712304 with the method defined by Imanishi et al. (2007), the spectra of which were obtained from the NASA/IPAC IR Science Archive (IRSA). On the other hand, we adopted the values given in each reference paper for the other AGNs. The blue dotted lines in Fig. 3 show the differences between our estimates and those by Stierwalt et al. (2013), which confirms that the differences between the different methods are not large enough to change a global relation. Figure 3 shows that galaxies with low IR luminosities (LIR < 1011 L⊙) show significantly shallow silicate absorption features, as already pointed out by Stierwalt et al. (2013). Imanishi (2009) suggested that the number of heavily obscured AGNs that have deep silicate absorption features (τsil > 2) increases with the IR luminosities of the host galaxies. Therefore, LEDA 1712304 may be a rare galaxy from the aspect of having both deep absorption feature τsil ∼ 2.3 and low IR luminosity (5 ± 1)×1010 L⊙. Such galaxies have hardly been observed; an exception is NGC 1377 (Roussel et al. 2006), as can be seen in Fig. 3. NGC 1377 is a lenticular galaxy (de Vaucouleurs et al. 1991), the stellar mass of which is 109.3 ± 0.1 M⊙ (Skibba et al. 2011). The IR spectrum of NGC 1377 shows a featureless continuum except the silicate feature due to circumnuclear dust (Imanishi 2006; Roussel et al. 2006).
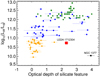 |
Fig. 3. Relation between the IR luminosity and the optical depth of the silicate feature for LEDA 1712304 and other AGNs (Stierwalt et al. 2013; Imanishi et al. 2007; Imanishi 2009; Roussel et al. 2006; Wu et al. 2010). Red and black squares represent LEDA 1712304 and NGC 1377 (Roussel et al. 2006), respectively. Blue, green, and orange circles, and green squares represent the AGN samples of Stierwalt et al. (2013), Imanishi et al. (2007), Wu et al. (2010), and Imanishi (2009), respectively. The IR luminosities obtained in each reference paper were used. The optical depth of the silicate feature for LEDA 1712304 and the AGN samples of Stierwalt et al. (2013), Wu et al. (2010), and Roussel et al. (2006) were estimated using the method defined by Imanishi et al. (2007), while the values in each reference paper were used for the other AGNs. The differences between our estimates and those by Stierwalt et al. (2013) are shown as blue dotted horizontal lines. |
The low IR luminosity reflects a relatively low star formation rate (SFR) in LEDA 1712304. We applied the cold dust luminosity Lcold in Table 3 instead of LIR to estimate the SFR, since LIR is likely to be contaminated with the AGN activity. The resultant SFR is 4 M⊙ yr−1, based on the LIR–SFR relation in Kennicutt & Evans (2012). Hence, star formation is not active in the host galaxy, which is also expected from the non-detection of the PAH features and from the stellar continuum model of an elliptical galaxy for the SED fitting. Kauffmann et al. (2003) reported that the stellar masses of AGN host galaxies range from 109.5 M⊙ to 1012 M⊙ based on the Sloan Digital Sky Survey (SDSS), whereas LEDA 1712304 has Mstar = (2.7 ± 0.8)×109 M⊙ (or 8 × 10⁹ M⊙ from the CIGALE fitting; see Sect. 3.2). Therefore, LEDA 1712304 belongs to the population of a considerably low mass class that harbors an AGN. Thus, the host galaxy is expected to be an early-type galaxy of low mass that even so possesses a heavily observed AGN; LEDA 1712304 is likely to belong to a population missed in the previous observations, and the above-mentioned NGC 1377 may be in an evolutionary stage similar to that of LEDA 1712304.
In Fig. 4, we compare the silicate feature profile of LEDA 1712304 with those of the other AGNs, classifying them with LIR. Figure 4 shows that many AGNs in a lower LIR class tend to have shallower silicate absorption features (τsil < 1), which is consistent with the trend in Fig. 3. Figure 4 also shows that the spectra of many AGNs, such as PAH 7.7 μm, 8.6 μm, 11.3 μm, H2 S(3) 9.66μm, and [S IV] 10.5μm, exhibit strong emission features in the wavelength range containing the silicate feature. On the other hand, LEDA 1712304 has one of the most featureless continua except the silicate features in the AGNs, and thus is expected to be one of the purest AGN-dominated galaxies in the AGNs. In Fig. 5, for the purpose of investigating the differences, if any, in the absorption profile, we also show the optical depth profiles of the silicate features for only the AGNs with deep silicate absorption features (τsil > 2), which are normalized by the optical depths averaged over the wavelength range of 9.8–10.3 μm that include no strong lines. Figure 5 shows that the silicate absorption profiles thus normalized are notably similar from galaxy to galaxy, although their LIR values are very different, and yet we find that the wings of the profiles vary on the shorter wavelength side. At around 9 μm, the wing of LEDA 1712304 is shifted significantly toward longer wavelengths than those of many other AGNs, especially those with LIR < 1012 L⊙, which can be explained by differences in the compositions of amorphous olivine (e.g., the difference between models 2 and 3, see bottom panel in Fig. 1) and/or the crystallinity (the difference between models 3 and 7).
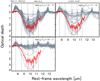 |
Fig. 4. Optical depth profiles of the silicate features for LEDA 1712304 (red) and the other AGNs (gray; Stierwalt et al. 2013; Imanishi et al. 2007; Imanishi 2009; Roussel et al. 2006; Wu et al. 2010). Top right, top, left, and bottom panels: optical depth profiles of the AGNs in the IR luminosity ranges of 1012–1013 L⊙, 1011–1012 L⊙, and 1010–1011 L⊙, respectively. Each optical depth profile is obtained by the absorption-free power-law continuum determined from the flux densities at 7.1 μm and 14.2 μm (Imanishi et al. 2007). The dashed lines show the positions of PAH 7.7, 8.6, and 11.3μm, H2 S(3) 9.66μm, and [S IV] 10.5μm. |
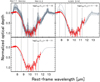 |
Fig. 5. Normalized optical depth profiles of the silicate features for LEDA 1712304 (red) and the other AGNs (gray; Stierwalt et al. 2013; Imanishi et al. 2007; Imanishi 2009; Roussel et al. 2006), which have deep silicate absorption features (τsil > 2). The normalization is performed by the mean optical depths in the wavelength range 9.8–10.3 μm, which includes no strong lines. The dashed lines show the positions of PAH 7.7, 8.6, and 11.3μm, H2 S(3) 9.66μm, and [S IV] 10.5μm. |
The above variations at around 9 μm could be produced by the PAH 7.7 and 8.6 μm features filling the silicate absorption. Since the galaxies are located at various distances, the spectroscopic apertures do not sample the same physical scales of the nuclei and thus the PAH emission from host galaxies with larger distances is expected to contaminate the spectra more strongly. We explore this possibility in Fig. 6, where the variations at around 9 μm are plotted as a function of the redshift. In the figure, the contamination of the PAH features from host galaxies would produce a decreasing trend with the redshift. However, Fig. 6 does not show any clear dependence on the distance and therefore we conclude that the aperture effects with the different distances do not make an appreciable contribution to the variations of the silicate absorption profiles.
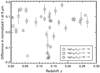 |
Fig. 6. Difference in the normalized optical depth at around 9 μm from that of LEDA 171304 as a function of the redshift, calculated by averaging the differences at 8.9–9.1 μm. A larger value indicates a deeper silicate feature at around 9 μm. Circles, squares, and diamonds correspond to the galaxies with LIR = 1012–1013 L⊙, 1011–1012 L⊙, and 1010–1011 L⊙, respectively. |
4.2. Silicate dust properties in LEDA 1712304
Such a deep silicate absorption calls for the presence of a strong dust temperature gradient (Imanishi et al. 2007) since both absorber and emitter in the mid-IR are of dust origin; the absorbing silicate dust is thought to be cooler dust in the outer region of the AGN torus or interstellar dust in the host galaxy, while the strong continuum emission at around 10 μm is attributed to hotter dust close to the AGN core. Here we consider the possibility that the absorbing dust is of interstellar origin in LEDA 1712304. As shown in Table 2, we estimated the column density of the absorbing dust with the spectral fitting, from which we calculate the whole mass of the silicate dust assuming the size of the galaxy, ∼15 kpc (SDSS DR6; Adelman-McCarthy et al. 2008)1, as the size of the absorbing dust layer. The resultant silicate dust mass is 9 × 10⁸ M⊙, which is much higher than the warm and cold dust masses in Table 3. On the other hand, assuming that the size of the absorbing dust layer is 100 pc, typical of a circumnuclear dusty torus, the silicate dust mass is estimated to be 4 × 10⁴ M⊙, which is reasonable when compared with the warm dust mass in Table 3. Therefore, the absorbing silicate dust is probably not of interstellar origin, but circumnuclear dust present in the outer region of the AGN torus.
The silicate feature of the AGN torus dust in LEDA 1712304 has a different profile from that of astronomical silicate. The result of the IR spectral fitting indicates that the difference in the silicate features is attributed to the composition, the physical structure of the dust, or both. The best-fit model (model 7) needs amorphous olivine as a dominant composition, which is consistent with the result of Spoon et al. (2006) for heavily obscured ULIRG nuclei. Given that the main composition of dust in the circumstellar dust shells around late M stars is also amorphous olivine (Roche et al. 2007), we speculate that the grains of amorphous olivine generated in old stars may have fallen into the galactic center, for example induced by a galaxy interaction, which can explain a dusty torus rich in amorphous-olivine around the AGN.
Spoon et al. (2004) suggested the presence of an unobscured emission component to explain the flat spectrum at the bottom of the silicate feature of a heavily obscured AGN. The model that considers an absorption-free continuum (model 4) gives a better fit to the spectrum of LEDA 1712304 than the model that only considers the obscured circumnuclear hot dust (model 2). An even better result of the IR spectral fitting was obtained for the porous amorphous olivine (models 5 and 7). The porosity of the silicate dust may be caused by coagulations or processing in the circumnuclear environments. The result of the IR spectral fitting also suggests that the dusty torus around the AGN in LEDA 1712304 is likely to contain crystalline silicate. Kemper et al. (2004) reported that the crystallinity of the diffuse interstellar silicate dust in our Galaxy is lower than 2.2% and the absence of crystalline silicate is explained by an amorphization process caused by cosmic-ray particle bombardment that occurs on a timescale significantly shorter than the destruction timescale. The crystallinity of silicate dust in the AGN torus in LEDA 1712304 is ∼4% from the IR spectral fitting, which is larger than that of the diffuse interstellar dust in our Galaxy. Therefore, the silicate dust in the AGN torus in LEDA 1712304 is likely to be relatively fresh, possibly formed in the circumnuclear dense environments.
5. Conclusions
We detect a deep (τsil ∼ 2.3) absorption feature due to silicate grains at around 10 μm in the AKARI/IRC near- to mid-IR spectrum of the nearby heavily obscured galaxy LEDA 1712304. The spectrum also shows a steep near- to mid-IR slope, indicating that LEDA 1712304 possesses a heavily obscured AGN. The IR luminosity and stellar mass of LEDA 1712304, LIR = (5 ± 1)×1010 L⊙ and Mstar = (2.7 ± 0.8)×109 M⊙, are notably low compared with other heavily obscured AGNs that show deep silicate absorptions. Thus, LEDA 1712304 may be a rare galaxy showing low LIR, low Mstar, but large τsil. On the other hand, we find that the spectral profile of the silicate feature in LEDA 1712304 is similar to those of the other AGNs, but significantly different in the wing on the shorter wavelength side, which can be explained by differences in the compositions and/or the crystallinity.
The absorbing silicate dust in LEDA 1712304 is not of interstellar origin but of circumnuclear origin, since the dust mass estimated from τsil and the size of the host galaxy is much larger than that estimated from the far-IR emission. From the IR spectral fitting, the main composition of the circumnuclear silicate dust in LEDA 1712304 is amorphous olivine, which is consistent with the previous studies (e.g., Spoon et al. 2006). In addition, the best-fit model of the IR spectral fitting calls for the porosity and the crystallinity of the silicate dust, which imply dust coagulation or processing and recent dust formation, respectively, in the circumnuclear environments.
Acknowledgments
We thank the referee for carefully reading our manuscript and giving us helpful comments. This work is based on observations with AKARI, a JAXA project with the participation of ESA, with the Spitzer Space Telescope, which is operated by the Jet Propulsion Laboratory, California Institute of Technology, under a contract with NASA, using the NASA/IPAC Infrared Science Archive and with Herschel, which is an ESA space observatory with science instruments provided by European-led Principal Investigator consortia and with important participation from NASA. The IRSF project was financially supported by the Sumitomo foundation and Grants-in-Aid for Scientific Research on Priority Areas (A) (Nos. 10147207 and 10147214) from the Ministry of Education, Culture, Sports, Science, and Technology (MEXT). The operation of IRSF is supported by Joint Development Research of National Astronomical Observatory of Japan, and Optical Near-Infrared Astronomy Inter-University Cooperation Program, funded by the MEXT of Japan.
References
- Adelman-McCarthy, J. K., Agüeros, M. A., Allam, S. S., et al. 2008, ApJS, 175, 297 [NASA ADS] [CrossRef] [Google Scholar]
- Antonucci, R. 1993, ARA&A, 31, 473 [Google Scholar]
- Armus, L., Charmandaris, V., Bernard-Salas, J., et al. 2007, ApJ, 656, 148 [NASA ADS] [CrossRef] [Google Scholar]
- Bohren, C. F., & Huffman, D. R. 1983, Absorption and Scattering of Light by Small Particles (New York: Wiley) [Google Scholar]
- Boquien, M., Burgarella, D., Roehlly, Y., et al. 2019, A&A, 622, A103 [NASA ADS] [CrossRef] [EDP Sciences] [Google Scholar]
- Burgarella, D., Buat, V., & Iglesias-Páramo, J. 2005, MNRAS, 360, 1413 [NASA ADS] [CrossRef] [Google Scholar]
- Calzetti, D., Armus, L., Bohlin, R. C., et al. 2000, ApJ, 533, 682 [NASA ADS] [CrossRef] [Google Scholar]
- Ciesla, L., Charmandaris, V., Georgakakis, A., et al. 2015, A&A, 576, A10 [NASA ADS] [CrossRef] [EDP Sciences] [Google Scholar]
- Cole, S., Norberg, P., Baugh, C. M., et al. 2001, MNRAS, 326, 255 [NASA ADS] [CrossRef] [Google Scholar]
- Cutri, R. M., Skrutskie, M. F., van Dyk, S., et al. 2003, VizieR Online Data Catalog: II/246 [Google Scholar]
- Cutri, R. M., Wright, E. L., Conrow, T., et al. 2013, Explanatory Supplement to the AllWISE Data Release Products, Tech. rep. [Google Scholar]
- de Vaucouleurs, G., de Vaucouleurs, A., Corwin, Jr., H. G., et al. 1991, Third Reference Catalogue of Bright Galaxies. Volume I: Explanations and references. Volume II: Data for galaxies between 0h and 12h. Volume III: Data for galaxies between 12h and 24h [Google Scholar]
- Dey, A., Soifer, B. T., Desai, V., et al. 2008, ApJ, 677, 943 [NASA ADS] [CrossRef] [Google Scholar]
- Dorschner, J., Begemann, B., Henning, T., Jaeger, C., & Mutschke, H. 1995, A&A, 300, 503 [Google Scholar]
- Draine, B. T. 2003a, ARA&A, 41, 241 [NASA ADS] [CrossRef] [Google Scholar]
- Draine, B. T. 2003b, ApJ, 598, 1026 [NASA ADS] [CrossRef] [Google Scholar]
- Fazio, G. G., Hora, J. L., Allen, L. E., et al. 2004, ApJS, 154, 10 [NASA ADS] [CrossRef] [Google Scholar]
- Griffin, M. J., Abergel, A., Abreu, A., et al. 2010, A&A, 518, L3 [Google Scholar]
- Hao, L., Weedman, D. W., Spoon, H. W. W., et al. 2007, ApJ, 655, L77 [NASA ADS] [CrossRef] [Google Scholar]
- Hwang, H. S., Andrews, S. M., & Geller, M. J. 2013, ApJ, 777, 38 [NASA ADS] [CrossRef] [Google Scholar]
- Imanishi, M. 2006, AJ, 131, 2406 [NASA ADS] [CrossRef] [Google Scholar]
- Imanishi, M. 2009, ApJ, 694, 751 [NASA ADS] [CrossRef] [Google Scholar]
- Imanishi, M., Dudley, C. C., Maiolino, R., et al. 2007, ApJS, 171, 72 [NASA ADS] [CrossRef] [Google Scholar]
- Imanishi, M., Nakagawa, T., Ohyama, Y., et al. 2008, PASJ, 60, S489 [NASA ADS] [CrossRef] [Google Scholar]
- Inami, H., Armus, L., Matsuhara, H., et al. 2018, A&A, 617, A130 [NASA ADS] [CrossRef] [EDP Sciences] [Google Scholar]
- Jaeger, C., Mutschke, H., Begemann, B., Dorschner, J., & Henning, T. 1994, A&A, 292, 641 [Google Scholar]
- Kauffmann, G., Heckman, T. M., Tremonti, C., et al. 2003, MNRAS, 346, 1055 [Google Scholar]
- Kemper, F., Vriend, W. J., & Tielens, A. G. G. M. 2004, ApJ, 609, 826 [NASA ADS] [CrossRef] [Google Scholar]
- Kennicutt, R. C., & Evans, N. J. 2012, ARA&A, 50, 531 [NASA ADS] [CrossRef] [Google Scholar]
- Laor, A., & Draine, B. T. 1993, ApJ, 402, 441 [NASA ADS] [CrossRef] [Google Scholar]
- Li, M. P., Shi, Q. J., & Li, A. 2008, MNRAS, 391, L49 [NASA ADS] [CrossRef] [Google Scholar]
- Lutz, D., Spoon, H. W. W., Rigopoulou, D., Moorwood, A. F. M., & Genzel, R. 1998, ApJ, 505, L103 [NASA ADS] [CrossRef] [Google Scholar]
- Murakami, H., Baba, H., Barthel, P., et al. 2007, PASJ, 59, S369 [NASA ADS] [CrossRef] [MathSciNet] [Google Scholar]
- Nagashima, C., Nagayama, T., Nakajima, Y., et al. 1999, in Star Formation, ed. T. Nakamoto, 397 [Google Scholar]
- Nagayama, T., Nagashima, C., Nakajima, Y., et al. 2003, in Instrument Design and Performance for Optical/Infrared Ground-based Telescopes, eds. M. Iye, & A. F. M. Moorwood, Proc. SPIE, 4841, 459 [NASA ADS] [CrossRef] [Google Scholar]
- Noll, S., Burgarella, D., Giovannoli, E., et al. 2009, A&A, 507, 1793 [NASA ADS] [CrossRef] [EDP Sciences] [Google Scholar]
- Ohyama, Y., Onaka, T., Matsuhara, H., et al. 2007, PASJ, 59, S411 [Google Scholar]
- Onaka, T., Matsuhara, H., Wada, T., et al. 2007, PASJ, 59, S401 [Google Scholar]
- Oyabu, S., Ishihara, D., Malkan, M., et al. 2011, A&A, 529, A122 [NASA ADS] [CrossRef] [EDP Sciences] [Google Scholar]
- Poglitsch, A., Waelkens, C., Geis, N., et al. 2010, A&A, 518, L2 [NASA ADS] [CrossRef] [EDP Sciences] [Google Scholar]
- Rieke, G. H., Young, E. T., Engelbracht, C. W., et al. 2004, ApJS, 154, 25 [NASA ADS] [CrossRef] [Google Scholar]
- Roche, P. F., Aitken, D. K., Smith, C. H., & James, S. D. 1986, MNRAS, 218, 19 [Google Scholar]
- Roche, P. F., Packham, C., Aitken, D. K., & Mason, R. E. 2007, MNRAS, 375, 99 [NASA ADS] [CrossRef] [Google Scholar]
- Roche, P. F., Alonso-Herrero, A., & Gonzalez-Martin, O. 2015, MNRAS, 449, 2598 [NASA ADS] [CrossRef] [Google Scholar]
- Roussel, H., Helou, G., Smith, J. D., et al. 2006, ApJ, 646, 841 [NASA ADS] [CrossRef] [Google Scholar]
- Sanders, D. B., & Mirabel, I. F. 1996, ARA&A, 34, 749 [NASA ADS] [CrossRef] [Google Scholar]
- Sani, E., Risaliti, G., Salvati, M., et al. 2008, ApJ, 675, 96 [NASA ADS] [CrossRef] [Google Scholar]
- Silva, L., Granato, G. L., Bressan, A., & Danese, L. 1998, ApJ, 509, 103 [NASA ADS] [CrossRef] [Google Scholar]
- Skibba, R. A., Engelbracht, C. W., Dale, D., et al. 2011, ApJ, 738, 89 [NASA ADS] [CrossRef] [Google Scholar]
- Spoon, H. W. W., Armus, L., Cami, J., et al. 2004, ApJS, 154, 184 [NASA ADS] [CrossRef] [Google Scholar]
- Spoon, H. W. W., Tielens, A. G. G. M., Armus, L., et al. 2006, ApJ, 638, 759 [NASA ADS] [CrossRef] [Google Scholar]
- Spoon, H. W. W., Marshall, J. A., Houck, J. R., et al. 2007, ApJ, 654, L49 [NASA ADS] [CrossRef] [Google Scholar]
- Stierwalt, S., Armus, L., Surace, J. A., et al. 2013, ApJS, 206, 1 [NASA ADS] [CrossRef] [Google Scholar]
- Stierwalt, S., Armus, L., Charmandaris, V., et al. 2014, ApJ, 790, 124 [NASA ADS] [CrossRef] [Google Scholar]
- Urry, C. M., & Padovani, P. 1995, PASP, 107, 803 [NASA ADS] [CrossRef] [Google Scholar]
- Wu, Y., Helou, G., Armus, L., et al. 2010, ApJ, 723, 895 [NASA ADS] [CrossRef] [Google Scholar]
- Yamagishi, M., Yamamura, I., Mizuki, T., et al. 2019, PASJ, 71, 3 [NASA ADS] [CrossRef] [Google Scholar]
All Tables
Summary of the results of the IR spectral fitting with various silicate dust models.
All Figures
|
Fig. 1. Top panel: AKARI/IRC spectrum of LEDA 1712304 shown together with the best-fit model (model 7; red solid line). Bottom panel: close-up view of the fitting results of the 10 μm silicate absorption feature with various spectral models and the residuals normalized by the errors. Black, purple, blue, green, orange, brown and red solid lines show the astronomical silicate (model 1), amorphous olivine (Mg2xFe2−2xSiO4, x = 0.5; model 2), amorphous olivine (x = 0.4; model 3), a combination of the amorphous olivine (x = 0.5) absorption and absorption-free emission component (model 4), the porous amorphous olivine (x = 0.4; model 5), the 1 μm-sized amorphous olivine (x = 0.4; model 6) and a mixture of the porous amorphous olivine (x = 0.4) and the crystalline pyroxene (model 7), respectively. |
| In the text | |
|
Fig. 2. Spectral energy distribution of LEDA 1712304. Filled squares correspond to the observed flux densities, while a downward triangle represents the 3σ upper limit. The AKARI/IRC spectral data at 2.5–12.5 μm are also included in the fitting. A red solid line shows the best-fit model, where the stellar, hot dust, warm dust, and cold dust components are shown by yellow, green, blue, and purple dashed lines, respectively. |
| In the text | |
|
Fig. 3. Relation between the IR luminosity and the optical depth of the silicate feature for LEDA 1712304 and other AGNs (Stierwalt et al. 2013; Imanishi et al. 2007; Imanishi 2009; Roussel et al. 2006; Wu et al. 2010). Red and black squares represent LEDA 1712304 and NGC 1377 (Roussel et al. 2006), respectively. Blue, green, and orange circles, and green squares represent the AGN samples of Stierwalt et al. (2013), Imanishi et al. (2007), Wu et al. (2010), and Imanishi (2009), respectively. The IR luminosities obtained in each reference paper were used. The optical depth of the silicate feature for LEDA 1712304 and the AGN samples of Stierwalt et al. (2013), Wu et al. (2010), and Roussel et al. (2006) were estimated using the method defined by Imanishi et al. (2007), while the values in each reference paper were used for the other AGNs. The differences between our estimates and those by Stierwalt et al. (2013) are shown as blue dotted horizontal lines. |
| In the text | |
|
Fig. 4. Optical depth profiles of the silicate features for LEDA 1712304 (red) and the other AGNs (gray; Stierwalt et al. 2013; Imanishi et al. 2007; Imanishi 2009; Roussel et al. 2006; Wu et al. 2010). Top right, top, left, and bottom panels: optical depth profiles of the AGNs in the IR luminosity ranges of 1012–1013 L⊙, 1011–1012 L⊙, and 1010–1011 L⊙, respectively. Each optical depth profile is obtained by the absorption-free power-law continuum determined from the flux densities at 7.1 μm and 14.2 μm (Imanishi et al. 2007). The dashed lines show the positions of PAH 7.7, 8.6, and 11.3μm, H2 S(3) 9.66μm, and [S IV] 10.5μm. |
| In the text | |
|
Fig. 5. Normalized optical depth profiles of the silicate features for LEDA 1712304 (red) and the other AGNs (gray; Stierwalt et al. 2013; Imanishi et al. 2007; Imanishi 2009; Roussel et al. 2006), which have deep silicate absorption features (τsil > 2). The normalization is performed by the mean optical depths in the wavelength range 9.8–10.3 μm, which includes no strong lines. The dashed lines show the positions of PAH 7.7, 8.6, and 11.3μm, H2 S(3) 9.66μm, and [S IV] 10.5μm. |
| In the text | |
|
Fig. 6. Difference in the normalized optical depth at around 9 μm from that of LEDA 171304 as a function of the redshift, calculated by averaging the differences at 8.9–9.1 μm. A larger value indicates a deeper silicate feature at around 9 μm. Circles, squares, and diamonds correspond to the galaxies with LIR = 1012–1013 L⊙, 1011–1012 L⊙, and 1010–1011 L⊙, respectively. |
| In the text | |
Current usage metrics show cumulative count of Article Views (full-text article views including HTML views, PDF and ePub downloads, according to the available data) and Abstracts Views on Vision4Press platform.
Data correspond to usage on the plateform after 2015. The current usage metrics is available 48-96 hours after online publication and is updated daily on week days.
Initial download of the metrics may take a while.