| Issue |
A&A
Volume 626, June 2019
|
|
|---|---|---|
| Article Number | A52 | |
| Number of page(s) | 21 | |
| Section | Atomic, molecular, and nuclear data | |
| DOI | https://doi.org/10.1051/0004-6361/201935435 | |
| Published online | 12 June 2019 | |
Prebiotic synthesis initiated in formaldehyde by laser plasma simulating high-velocity impacts
1
J. Heyrovský Institute of Physical Chemistry, Academy of Sciences of the Czech Republic, Dolejkova 3, 18223 Prague 8, Czech Republic
2
Sorbonne Université, Muséum National d’Histoire Naturelle, UMR CNRS 7590, Institut de Minéralogie, de Physique des Matériaux et de Cosmochimie, IMPMC, 75005 Paris, France
3
Charles University in Prague, Faculty of Science, Department of Physical and Macromolecular Chemistry, Albertov 2030, 12840 Prague 2, Czech Republic
4
Department of Radiation and Chemical Physics, Institute of Physics, Czech Academy of Sciences, Na Slovance 1999/2, 18221 Prague 8, Czech Republic
5
Institute of Plasma Physics, Czech Academy of Sciences, Za Slovankou 1782/3, 182 00 Prague 8, Czech Republic
6
Institute of Biophysics of the Czech Academy of Sciences, Královopolská 135, 61265 Brno, Czech Republic
e-mail: This email address is being protected from spambots. You need JavaScript enabled to view it.
7
CEITEC – Central European Institute of Technology, Masaryk University, Campus Bohnice, Kamenice 5, 62500 Brno, Czech Republic
8
University of Cambridge, Cavendish Astrophysics, J.J. Thomson Avenue, Cambridge CB3 0HE, UK
9
Laboratory of Molecular Biology, Francis Crick Avenue, Cambridge CB2 OQH, UK
Received:
8
March
2019
Accepted:
1
May
2019
Abstract
Context. It is well known that hydrogen cyanide and formamide can universally be considered as key molecules in prebiotic synthesis. Despite the fact that formamide has been detected in interplanetary and interstellar environments, other prebiotic species are far more abundant, including, for example, formaldehyde. However, several results indicate that formamide can play the role of important intermediate as well as that of a feedstock molecule in chemical abiogenesis. Diverse recently proposed scenarios of the origins of the first biopolymers show that liquid formamide environments could have been crucial for the formation of nucleobases, nucleosides, and for phosphorylation reactions, which lead to nucleotides.
Aims. Here we report on a wide exploration of the formaldehyde reaction network under plasma conditions mimicking an asteroid descent in an Earth-like atmosphere and its impact.
Methods. Dielectric breakdown using a high-power kJ-class laser system (PALS – Prague Asterix Laser System) along with quantum mechanical, ab initio molecular dynamics, and enhanced sampling simulations have been employed in order to mimic an asteroid impact plasma.
Results. Being more abundant than formamide both in interstellar and interplanetary environments, during the era of early and late heavy bombardment of Earth and other planets, formaldehyde might have been delivered on asteroids to young planets. In the presence of nitrogen-bearing species, this molecule has been reprocessed under plasma conditions mimicking the local environment of an impacting body. We show that plasma reprocessing of formaldehyde leads to the formation of several radical and molecular species along with formamide.
Conclusion. All the canonical nucleobases, the simplest amino acid (i.e., glycine), and the sugar ribose, have been detected after treatment of formaldehyde and nitrogen gas with dielectric breakdown. Our results, supported by quantum mechanical and enhanced sampling simulations, show that formaldehyde – by producing inter alia formamide – may have had the role of starting substance in prebiotic synthesis.
Key words: astrochemistry / astrobiology / molecular processes / plasmas / meteorites / meteors / meteoroids
© ESO 2019
1. Introduction
The last decade has witnessed the effort made in elucidating the relevance of two parent compounds that have become crucial in the search for the origin of biologically relevant molecules in one-pot synthesis: hydrogen cyanide (HCN; Ferus et al. 2017a; Xu et al. 2017; Civis et al. 2017; Sutherland 2016, 2017; Powner & Sutherland 2011; Powner et al. 2011) and its hydration product, formamide (HCONH2; Sponer et al. 2016; Ferus et al. 2015b, 2017b; Rotelli et al. 2016; Saladino et al. 2012a,b, 2015, 2016). The main sources of HCN are ascribed to the reprocessing of atmospheres degassed from impacting interplanetary matter (Kuwahara & Sugita 2015; Zahnle et al. 2010) by electric discharges, impact plasma (Ferus et al. 2017a), or – since young protostellar objects are rich in cyano-compounds (Oberg et al. 2015; Al-Edhari et al. 2017; Oberg 2016) – also by direct exogenous delivery of complex and volatile cyanides. Instead, formamide has been inter alia identified in the interstellar environment (Adande et al. 2013; Raunier et al. 2004) including well-known objects, such as the young solar-type protostar IRAS 16293–2422 (Kahane et al. 2013) and the comet 67P/Churyumov-Gerasimenko (Goesmann et al. 2015). Under early Earth conditions, a plethora of chemical pathways directly heading toward the formamide synthesis have been identified. Among them, HCN hydrolysis in sea water (Saladino et al. 2012a), reprocessing of simple Miller reducing atmospheres, such as CH4, NH3, H2O, H2, (Miller 1953) and CO, CO2, N2, NH3, H2, H2O (Abelson 1956), or HCHO and their various combinations (Rode 1999; Saitta & Saija 2014; Ferus et al. 2017b), or even ammonium-formate dehydratation (Sponer et al. 2016), and gamma irradiation of acetonitrile (Adam et al. 2018) hold a key place in the prebiotic chemistry realm.
The analysis of trace elements in a statistically significant number of ancient zircons shows a decreasing trend of the oxygen fugacity more than 3.6 Gyr ago, suggesting therefore that early conditions were reducing (Yang et al. 2014). This discovery is consistent with a scenario proposing terrestrial synthesis of biomolecules under reducing conditions created by specific substances possibly delivered by impacts of extraterrestrial bodies rich in refractory carbonaceous material (Yang et al. 2014; Hashimoto et al. 2007; Ferus et al. 2017a). Besides, explorations on impact degassing show that Earth’s early atmosphere was indeed very reducing, rich in H2 and/or CH4, regardless of which meteoritic materials accreted independently of the chemical reactions controlling the molecular abundances of the atmosphere (Kuwahara & Sugita 2015; Sponer et al. 2016). However, according to our recent results, such conditions led to the synthesis of large amounts of HCN (Ferus et al. 2017a; Civis et al. 2016b). On the other hand, the quantitative extent of the reducing conditions of the environment is still uncertain and the exact composition of the reducing mixture remains unknown. The recent finding of a wide palette of organic substances (Martins 2011) and biomolecules in chondritic meteorites (Martins et al. 2008, 2015) supports the chemical panspermia hypothesis. Moreover, the environment on early Earth was certainly influenced by the delivery of a wide range of organic substances such as formamide, formaldehyde, and hydrogen cyanide. These compounds might also have played the role either of parent compounds or of intermediates in prebiotic processes (Ferus et al. 2017b; Civis et al. 2017).
In spite of the relevance of the chemistry arising from HCN or formamide (Cassone et al. 2018a; Ferus et al. 2018; Sponer et al. 2016), other plausible scenarios should be investigated in order to identify their likelihood, their potential role in exogenous or endogenous prebiotic synthesis, and their connection to already known mechanisms. As an example, the original simple “Miller molecules” (Miller 1953; Abelson 1956; Miyakawa et al. 2002) can be connected both with an HCN- and a formamide-based chemistry. A mixture of ammonia, carbon monoxide, and water produces formamide as a reactive intermediate in the synthesis of nucleobases and amino acids initiated with plasmas produced by laser radiation, electrical discharges, and very intense electric fields (Saitta & Saija 2014). Albeit a Miller reducing atmosphere containing methane, molecular nitrogen, and carbon monoxide provides similar palettes of nucleobases and glycine, its chemistry is exclusively related to HCN (Civis et al. 2017; Hoerst et al. 2012). In addition, the formation of amino acids in simple Miller mixtures is customarily explained by the Strecker synthesis (Strecker 1850, 1854; Cleaves 2008; Lazcano & Bada 2003; Schlesinger & Miller 1983) which is, in turn, connected with HCN and formaldehyde or also with a cyanamide-HCN chemistry (Parker et al. 2014).
In this study, we present the reaction network stemming from the plasma chemistry of formaldehyde, a plausible prebiotic precursor of amino acids and, more importantly, sugars (Cassone et al. 2018b; Strecker 1854; Fox & Windsor 1971; Cleaves 2008). The simplest aldehyde is highly relevant to the composition of the primordial environment on early Earth and it is typically far more abundant than formamide in several interstellar objects, as displayed in Table 1. Formaldehyde has also been identified as a sizable component of carbonaceous chondrites and cometary refractory material (Bernstein et al. 1995) and it represents a possible precursor of the sugar compounds discovered in C-meteorites (Cooper et al. 2001). According to the theory of RNA world (Gilbert 1986) nucleobases ribose and phosphate are the basic compounds for the formation of the first living structures as early (Bell et al. 2015; Mojzsis et al. 1996) as 4.28 Gyr ago (Dodd et al. 2017). In our previous study (Civis et al. 2016a; Ferus et al. 2008), we demonstrated that synthesis of ribose from formaldehyde can be initiated by asteroid impact plasma. In this study we focus on the one-pot synthesis of nucleobases starting with the reprocessing of formaldehyde upon nitrogen atmosphere in high-energy-density events – such as an asteroid or cometary impact in a planetary atmosphere – using the kJ-class laser system PALS (Prague Asterix Laser System; Jungwirth et al. 2001) delivering in this experiment a pulse energy of up to 150 J. In conjunction with quantum chemistry calculations and enhanced sampling simulations, here we answer fundamental questions on the formaldehyde plasma chemistry and the resulting formation of biologically relevant molecules.
Column density Ntot expressed in cm−2 of formamide and formaldehyde in several interstellar objects and the Halle Bopp comet.
2. Methods
Here we explore HCHO + N2 plasma chemistry using a wide range of experimental (and computational) techniques. A solution of formaldehyde was irradiated upon a nitrogen atmosphere by a high-power laser. The resulting gas phase was analyzed using Fourier transform infrared (FTIR) absorption spectrometry, whilst the residua after evaporation of water under vacuum were analyzed by means of gas chromatography-mass detection (GC-MS) spectrometry. In order to monitor simple dissociation fragments of formaldehyde, we employed high-resolution time-resolved FTIR emission spectrometry and high-resolution optical emission spectrometry (OES). Again, the resulting stable discharge products trapped in liquid nitrogen were analyzed using FTIR absorption spectrometry. Finally, the formation of important products was investigated using advanced quantum chemical calculations and compared with experimental results. Details of all these procedures are described below.
2.1. Laser-produced plasma experiments
These experiments have been conducted using a glass irradiation cell equipped with a Pyrex window with a diameter of 10 cm, filled with 1 ml of formaldehyde solution in water (reagent grade, Sigma Aldrich) and 1 atm of inert nitrogen gas. The sample was subsequently transferred to PALS and irradiated by a sequence of 25 single laser pulses (a pulse duration of 350 ps, a wavelength of 1315.2 nm, an energy of 150 J) in the presence of a wide range of catalytic materials (neat formaldehyde solution in water, in the presence of montmorillonite clay, anatase titanium dioxide, and a sample of basaltic rock). The diameter of the laser beam behind the fourth amplifier was 15 cm. One pulse was delivered every 25 min. The laser beam was focused using a CaF2 lens to achieve an output intensity of approximately 1014 − 1016 W cm−2. The experiment mimics the high-density energy plasma in an asteroid impact (plasma temperature of 4500 K, shock wave, emission of energetic photons, especially UV and XUV radiation, and charged particles). FTIR inspection of the gaseous samples was performed using high-resolution Fourier transform infrared (HR-FTIR) spectra of the vapor phase. They were measured in a multipass White cell reaching an optical path of 35 m. The cell was interfaced to a sealable glass vacuum line used for the transfer of the gaseous and volatile phase from the irradiation cell. The spectrometer Bruker IFS 125 HR was subsequently evacuated and operated in the measurement mode from 650 − 5500 cm−1 using a HgCdTe nitrogen cooled detector and a KBr beamsplitter. Three hundred scans were acquired with 40 kHz scanning mirror speed with a resolution of 0.02 cm−1. The measured interferograms were apodized with the Blackmann–Harris apodization function. The discharge products from the following experiments have been also analyzed using the same procedure after evaporation from the liquid nitrogen trap.
2.2. Discharge experiments
Discharge experiments have been conducted in a glow discharge emission cell for spectroscopic monitoring of unstable products using time-resolved spectroscopy. The principles of the method have been discussed in our previous papers (Ferus et al. 2011a,b; Civis et al. 2012a,b,c,d, 2013). Briefly, a mixture of formaldehyde vapors with nitrogen buffer gas was led to a positive column discharge tube equipped with CaF2 windows. The emission spectra from discharge plasma in different gas mixtures were observed with the time-resolved Fourier transform high-resolution Bruker IFS 120 HR interferometer. The AC discharge was maintained by a high-voltage transistor switch HTS 81 (Behlke electronic GmbH, Frankfurt, Germany) applied between the stainless steel anode and the grounded cathode. The plasma was cooled by liquid water in the outer jacket of the cell. The voltage drop across the discharge was 1000 V, with a pulse width of 22 μs and 0.6 A peak-to-peak current. The scanner velocity of FTS was set to produce a 10 kHz He–Ne laser fringe frequency, which was used to trigger the discharge pulse. The recorded spectral range was 1800 − 4000 cm−1 with an optical filter, at an unapodized resolution of 0.02 cm−1. Fifty scans were averaged to obtain a reasonable signal-to-noise ratio. The initial pressure was varied from 1 to 10.0 Torr. The detection of highly excited atomic, radical, or ionic products in the range of UV-Vis spectra was also covered by high-resolution emission spectroscopy. During the discharge process, an optical cable with a built-in mirror was used to record the emission from the discharge cell by the high-resolution UV–Vis spectrometer Echelle ESA 4000. Such an apparatus makes it possible to measure the emission spectra in the interval 200 − 800 nm, that is, from the middle ultraviolet range to the beginning of the near infrared region with spectral resolution ranging from 0.005 nm (200 nm) to 0.019 nm (780 nm).
2.3. Detection of biologically relevant organic molecules
Gas chromatography-mass detection spectrometry analysis of the non-volatile fraction of the products formed upon irradiation with a high-power laser was conducted after filtration of the liquid sample extracted from the irradiation cell. The filtrates were evaporated under vacuum inside a vial vessel and analyzed for the presence of nucleobases and glycine. The measurements were performed using an ITQ 1100 GC-Ion Trap MS system (ThermoScientific, USA), equipped with an Xcalibur MS Platform using a non-polar TG-SQC column (ThermoScientific, USA). The dried solid residue was derivatized for 120 min at 110°C in 240 μl of pyridine aprotic reaction solvent (99.9%, Sigma Aldrich) and N-(tert-butyldimethylsilyl)-N-methyl-trifluoroacetamide (99% MTBSTFA, CAS 77377-52-7, Sigma Aldrich) at a ratio of 3:1. After the derivatization process, 1 μl of derivative was injected into the nonpolar column TG–5MS of a Trace 1300 Series gas chromatograph equipped with a mass detector MS 1100 ion trap and analyzed using a temperature gradient 10°C min−1 in the range of 180 − 280°C. Chromatograms and mass spectra have been compared with standards of uracil (U), thymine (T), cytosine (C), adenine (A), guanine (G), urea, and glycine (GL).
2.4. Quantum chemical calculations, ab initio molecular dynamics, and enhanced sampling simulations
In this study, two chemical reactions were simulated by means of traditional quantum-based calculations as well as finite-temperature ab initio molecular dynamics (AIMD) coupled with enhanced sampling techniques. In particular, the following gas-phase reactions were investigated:
 (1)
(1)
 (2)
(2)
Static zero-kelvin calculations of the thermochemistry of these reactions were carried out with the Orca software package (Frank 2012). The following assumptions hold within these traditional quantum-based thermochemistry calculations: (1) the electronic state is orbitally nondegenerate; (2) there are no thermally accessible electronically excited states; (3) all vibrations are strictly harmonic. In this way, by employing the hybrid meta exchange and correlation functional PW6B95 (Zhao & Truhlar 2005), the different energetic and (approximate) entropic contributions characterizing those reactions have been determined at 300 K, 650 K, and 4500 K. Moreover, Grimme’s D3 dispersion corrections (Grimme et al. 2010, 2011) with Becke–Johnson (BJ) damping have been taken into account, whereas a gaussian basis set of quadrupole zeta valence quality (def2-QZVP; Weigend & Ahlrichs 2005) has been chosen along with the def2/J auxiliary basis set (Weigend 2006).
With the aim of disclosing the reaction pathways and transition states (TSs) through a more accurate treatment of the entropic contributions, also finite-temperature Born-Oppenheimer (BO) molecular dynamics (MD) simulations combined with enhanced-sampling metadynamics (MetD) techniques (Laio & Parrinello 2002; Pietrucci & Saitta 2015) have been performed. In such a way, estimates of the free energy barriers characterizing the investigated processes can be evaluated by more appropriately including the entropic contributions as well (Pietrucci 2017; Cassone et al. 2017a,b). AIMD simulations were carried out using the software suite CP2K (Hutter et al. 2014) in conjunction with PLUMED-2.3 (Tribello et al. 2014), a patch that allows for enhanced sampling calculations. Cubic simulation cells of sides equal to 9.9 Å were built in order to reproduce the gas-phase behavior of reactions (1) and (2) by employing typical atomic-based (gaussian) basis sets (i.e., TZVP). Goedecker–Teter–Hutter (GTH; Goedecker et al. 1996) pseudopotentials were adopted whereas exchange and correlation effects were handled by means of the BLYP functional (Becke 1988; Lee et al. 1988) along with Grimme’s D3(BJ) dispersion corrections (Grimme et al. 2010, 2011) in MetD simulations. A time step equal to 0.5 fs was set. The temperature was controlled by means of the stochastic velocity rescaling method (Bussi et al. 2007) with a time constant equal to 2 fs. Parallel runs employing different heights of the bias were performed at 650 K for reactions (1) (see Fig. A.1 of the Supporting Information (SI) file) and (2). Once the most appropriate height of the applied bias was identified, three parallel simulations were executed, stopping them immediately after the occurrence of the reaction, in order to obtain from the final bias potential an estimate of the free-energy barriers along with their respective error bars as dispersion of the equivalent simulations (see, e.g., Fig. A.2). The dynamics of ions was simulated classically using the Verlet algorithm.
The MetD formalism here adopted employs the matrices of coordination numbers with the aim of defining a given molecular state, and exploits path-CV MetD (Branduardi et al. 2007; Pietrucci & Saitta 2015), based on two collective variables (CV), S and Z, on which the free-energy surface is constructed. The former variable represents the progress along the chemical transformation whereas the latter represents the distance from the predefined (idealized) pathway. In our case, however, only the reactants’ and the products’ reference structures have been employed to define the chemical path of each of the investigated reactions. This way, no prejudice on the chemical route undertaken by the systems is introduced. During the calculations, the following parameters have been adopted for the coordination function (see Eq. (3) of Pietrucci & Saitta 2015): N = 6, M = 12,  for S, S′=O, C, N, 1.5 Å for S = O, C, N, S′=H, and 1.4 Å for S = S′=H. In particular for reaction (1), the oxygen, the two carbon, and the nitrogen atoms have been selected in order to identify the reactants and the product states whereas, for reactions (2), the oxygen, the carbon, the nitrogen, and one hydrogen belonging to the formaldehyde molecule have been included for the coordination matrices. The parameter λ has been set such that λD(R1, R2) ∼2.3 (where R1 and R2 are the reference configurations) in order to obtain a smooth free energy landscape. The MetD potential was composed of gaussians with widths of σs = 0.02 and σz = 0.10, whereas different gaussian heights (i.e., equal to 2.4, 4.8, and 7.2 kcal mol−1) deposed every 50 fs (i.e., every 100 MD steps) have been tested.
In order to characterize the TSs of the reactions, committor analysis (Bolhuis et al. 2002) has been performed. By choosing dozens of structures along reactive pathways that were considered as plausible candidates for being the TS of each ‘reaction, 50 unbiased trajectories of 300 fs each, differing for the initial random velocities, were performed. We have identified a configuration as belonging to the TS ensemble when it is committed to the reactants or products basin with a probability of 50 ± 5%.
3. Results and discussion
3.1. Simple products of formaldehyde decomposition
In order to describe the main decomposition channels of formaldehyde in the presence of nitrogen under plasma conditions, emission spectra of glow electric discharge have been recorded using OES by the high-resolution Echelle spectrograph and FTIR time-resolved spectrometer. Stable products were trapped in liquid nitrogen and, after their evaporation into a multipass cell, absorption spectra were measured using a high-resolution FTIR spectrometer. The OES and FTIR survey of HCHO decomposition products in electric discharge is depicted in Fig. 1 (panels A and B) whilst FTIR absorption spectra are shown in panel C.
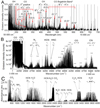 |
Fig. 1. Spectroscopic survey of HCHO + N2 glow electric discharge plasma in spectral ranges of optical and near together with middle ultraviolet emission (panel A), shown in nanometer scale, and middle infrared emission (panel B), shown in cm−1 scale. In this figure, we show appropriate spectral units commonly used in each particular region; corresponding wavenumbers and wavelengths are also illustrated for both spectral ranges. Dominant molecular and radical emission bands belong to •OH, CO, •CH, •CN, N2, CO2, HCN, HNC species (Okabe 1970; Nemes et al. 2000; Camacho et al. 2008; Rothman et al. 2013; Civis et al. 2008, 2016b). Panel C depicts FTIR absorption spectra of discharge products trapped in the liquid nitrogen trap. Besides HCN and CO2, NH3, C2H2, H2O, HCOOH, and N2O molecules are additionally detected. |
Besides atomic emission lines of H–C–O–N, OES shows that the main dissociation product of formaldehyde in the presence of nitrogen is carbon monoxide. HCO radical, as the most probable primary decomposition product, was detected neither by OES nor by time-resolved FTIR. However, this decomposition channel of formaldehyde is well known and our results, as well as a survey of kinetics (Manion et al. 2015), show that under specific conditions of glow discharge plasma, HCO is naturally quickly decomposed into CO or, alternatively, reacts forming OH or CH. Moreover, as depicted in the scheme of the main formaldehyde decomposition pathways supplied in Fig. 2 (panel A), also other intermediates can be involved in the underlying reaction network. Using FTIR spectrometry, we have also detected CN and HCN-HNC as major products of the formaldehyde decomposition in presence of N2. Both species can be clearly formed in radical chemistry, whereas the initiation step is likely the formaldehyde transformation into CH and its further collision with atomic nitrogen. Using absorption FTIR spectroscopy, strong bands of CO2, C2H2, and NH3 have also been recorded. In particular, HCN and NH3 may play a crucial role in the further reprocessing of formaldehyde and its decomposition products into molecules that are relevant for the synthesis of the major building blocks of biomolecules, as discussed in detail in the following sections and depicted in Fig. 2 (panel B). Among the major channels of formaldehyde decomposition under plasma conditions in the presence of N2, we mainly focused on the investigation of formamide formation and the synthesis of glycolonitrile. We selected three main mechanisms highlighted in Fig. 2 (panel A) in red arrows and marked R1 for glycolonitrile and R2 and R3 for formamide. The synthesis was investigated by means of an accurate laboratory simulation of the hypervelocity impact using terawatt-class high-power lasers.
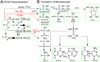 |
Fig. 2. Panel A: reprocessing of HCHO in plasma upon a nitrogen atmosphere. Panel B: further formation of basic substances of the RNA genetic code. Particular reactions indicated in panel A are listed in the database NIST (Manion et al. 2015) whereas formation of biomolecules is described in, for example, Menor-Salvan & Marin-Yaseli (2012). |
3.2. Impact plasma reprocessing and formamide synthesis
As mentioned in the Introduction, formaldehyde represents a ubiquitous species in disparate environments in the Universe. In almost all of them, it is far more abundant than formamide, a well-known precursor of a wide range of biologically relevant molecules. We should mention that this molecule contains all the basic bio-macroelements and exhibits a reasonable stability and a good reactivity for prebiotic synthesis starting with its condensed-phase exposition to heat (Saladino et al. 2001, 2007), UV irradiation (Barks et al. 2010; Botta et al. 2017), electric discharges (Saitta & Saija 2014), radioactivity (Saladino et al. 2015, 2017; Ferus et al. 2015a), or asteroid impact shock waves (Ferus et al. 2012, 2015a). On the other hand, formaldehyde does not contain nitrogen and, for any further prebiotic synthesis, the nitrogen atom has to be included in the reaction chains. The situation is very similar to the synthesis based on hydrogen cyanide, where the lack of oxygen requires that the latter atom enters reactions of prebiotic synthesis, for example, through water molecules (e.g., Civis et al. 2017 and references therein). On early Earth, in principle, one might consider two major inorganic sources of nitrogen: molecular nitrogen N2 and ammonia NH3. In our study, we focus on the exploration of atmospheric N2 reactivity, whereas as a plausible source of HCHO we shall consider exogenous delivery from comets or asteroids.
The impact of an extraterrestrial body rich in formaldehyde into atmospheres containing N2 produces hot air glow plasma, ablation of the descending body, generation of shock waves, and considerable reprocessing of all chemical species. The descending body is surrounded by excited atomized gas and reactive radicals (Borovicka & Berezhnoy 2016; Berezhnoy & Borovicka 2010). Almost independently of the mass of the body, the spectra of meteors, bright heavy bolides and presumably also asteroids, exhibit temperatures ranging from 4000 to 6000 K, mainly depending on their velocity (Jenniskens et al. 2004). The typical value is T = 4500 K at a velocity of 25 km s−1. The chemical consequences of such harsh and very specific conditions can be simulated under strictly controlled laboratory conditions only if we adopt several approaches and simplifications. The process of micrometeorite impact is usually simulated by supersonic guns, which do not allow the simulation of air glow plasma. Moreover, the typical velocity of projectiles fired by these systems reaches 10 km s−1. This value, however, represents the lower limit of the velocities reached on orbital or collision trajectories of interplanetary matter. On the other hand, according to our explorations of laser plasma physical chemistry, high-power lasers are able to simulate air glow plasma very well. The typical excitation temperature of atomized gas in a fireball generated by the high-power iodine laser PALS, reaches 4500 K, a value close to that of the meteor plasma air glow. The laser pulse also generates considerable shock waves in the gaseous medium and the energy delivered in one 300-ps pulse reproduces the energy released by a small (about 1 m in diameter) impacting body. Moreover, this kind of experiment offers controlled laboratory conditions, a vacuum sealed reaction vessel, a fast survey of spectra, and the further exploration of solid residua for the possible presence of biologically relevant organic molecules after a series of laser-induced shocks.
After a sequence of 25 150-J-laser pulses (delivering a total energy of 3750 J), the gas phase over a formaldehyde-water solution upon nitrogen atmosphere was inspected by high-resolution FTIR spectrometry. Our analysis shows that HCHO is reprocessed into simple molecular products such as carbon monoxide, carbon dioxide, methanol, acetylene, and nitrous oxide. The corresponding absorption spectrum is shown in Fig. 3 (panel A). In comparison with the purely gaseous phase experiments conducted upon pulsed electric discharges conditions presented in the previous section, hydrogen cyanide was not detected. However, the present results suggest that the latter molecule must be formed as an intermediate in laser-produced plasma similarly to the scheme supplied in Fig. 2 (panel A). HCN should have been dissolved in the formaldehyde solution and should have reacted with glycolonitrile, as indicated in Fig. 2 (panel B). HCN is formed not only by the decomposition of formaldehyde, as suggested by the results emerging from pulsed electric discharge experiments, but together with a CN radical, which also plays a role in the formation as well as in the decomposition of all the products involved in the prebiotic chemical pathways shown in Fig. 2 (panel B). In the same panel, species indicated by green frames have been detected after laser pulse treatment of formaldehyde solutions in water upon a nitrogen atmosphere.
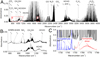 |
Fig. 3. Panel A: high-resolution FTIR absorption spectroscopy survey of formaldehyde treated in the presence of montmorillonite by the action of plasmas formed by laser-induced dielectric breakdown (LIDB). Rectangles B and C: spectral range of AHMN, AHAN, and formamide dimer vibration bands magnified in the panels B and C, respectively. |
In the processes following the formaldehyde decomposition, we observed the formation of 2-amino-2-hydroxy-acetonitrile (AHAN) and 2-amino-2-hydroxy-malononitrile (AHMN; Ferus et al. 2012) detected as an important product of the reaction between formamide and CN-radical. These intermediates play a relevant role in the formation of all the canonical RNA nucleobases under high-energy-density conditions, as explained in detail in our previous papers (Ferus et al. 2012, 2015b) and as schematically depicted in Fig. 2 (panel B). In addition, formamide has also been identified among the reaction products of the formaldehyde decomposition. The absorption spectra of AHAN and AHMN are magnified in Fig. 3 (panel B). The absorption band of the formamide dimer, typically formed under laser plasma conditions (Ferus et al. 2012) from the formamide monomer, is depicted in Fig. 3 (panel C). Although several results have demonstrated that formamide exhibits a very strong tendency to form noncovalent (H-bound) dimers even in gas phase, our observations repeatedly show that formamide does not form dimers in the gas phase without exposition to laser spark, heat, or freezing by liquid nitrogen. Therefore, we expect that the observation of formamide in its dimer form proves – independently – that this molecule is a de novo product of the plasma chemistry taking place on surfaces exposed to the expanding laser plasma fireball. Finally, we stress here the importance of the role held by surfaces. In fact, in purely gas phase chemistry, we expect that the preferred formation of neat, simple molecular gases follows those depicted in the spectra shown in Figs. 1 and 3 (panel A), as described in Fig. 2 (panel A).
3.3. Chemistry network studied by quantum chemical calculations, ab initio molecular dynamics, and metadynamics simulations
3.3.1. Channel 1: HCHO + HCN → HOCH2CN
In order to elucidate the energetics underlying the chemical conversion of formaldehyde and HCN into glycolonitrile (HOCH2CN) (i.e., reaction (1)), static quantum-based techniques have been firstly employed. This way, the Gibbs energy of the reactants (R), the TS, and the product (P) of reaction (1) has been evaluated, as shown in Fig. 4. Although at standard (300 K) and moderately high temperatures (650 K) glycolonitrile is more stable than HCHO + HCN, at extreme temperature regimes (4500 K) a stability inversion between the reactants and the product has been observed. In fact, whereas the reactants are less stable than the product by 10.1 kcal mol−1 and 7.4 kcal mol−1 at 300 K and 650 K, respectively, they become more stable by 8.2 kcal mol−1 at 4500 K. Glycolonitrile, representing hence a reactive molecule at high temperature regimes, is indeed not detected during the experiments and is likely employed as a means for the further complexification of the sample. At the same time, a sizable decrease of the barrier height – rescaled by kBT – of reaction (1) has been recorded when the temperature increases. In fact, although an absolute Gibbs energy barrier of 59.8 kcal mol−1 and 62.3 kcal mol−1 characterizes the reaction at 300 K and 650 K, respectively, an energetic supply of 86.0 kcal mol−1 has to be invested in order to trigger the reaction at 4500 K. Once rescaled, these values indicate that the barrier height at 4500 K is ten times lower than that at 300 K, whereas the barrier at 650 K is two times lower than that at room temperature. On the other hand, these activation energies are mainly due to the fact that HCN is a weak acid and the TS is an energetically unfavored zwitterion. Incidentally, the plot of Fig. 4 is in qualitative agreement with the Hammond–Leffer postulate.
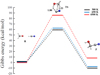 |
Fig. 4. Gibbs energy of reaction (1) determined through the hybrid meta exchange and correlation functional PW6B95 and Grimme’s D3(BJ) dispersion corrections. Some distances (in Å) characterizing the TS are shown. |
Albeit the electronic structure has been characterized by means of a recent hybrid meta exchange and correlation functional developed for thermochemistry and thermochemical kinetics (i.e., PW6B95; Zhao & Truhlar 2005 and in the presence of a properly large basis set, it is worth mentioning that drastic approximations (i.e., harmonic) on the entropic contribution may render questionable the temperature-induced Gibbs energy changes calculated by means of traditional static quantum chemistry calculations. Thus, additional simulations exploiting AIMD coupled with enhanced sampling techniques have been conducted.
Notwithstanding the differences in the two approaches, an attempt to compare the energy barriers and the TSs determined through traditional quantum chemical calculations and recently developed MetD schemes (Pietrucci & Saitta 2015) may be useful. In fact, when the latter approach is coupled with AIMD simulations, a fully anharmonic treatment of the entropic contributions is performed by construction. Moreover, such a MetD approach represents a valuable tool in order to characterize the molecular mechanism and, at the same time, gives an estimate of the free-energy barrier characterizing the reaction channel connecting formaldehyde and HCN, on one side, and glycolonitrile (HOCH2CN), on the other. To this aim, several gas-phase AIMD simulations exploiting the BLYP-D3(BJ) exchange and correlation functional have been performed in conjunction with advanced MetD techniques at 650 K. In Fig. 5, the MetD bias deposited on the CV region ascribed to the reactants of reaction (1) until the occurrence of the reaction is shown. In particular, from the depth of such a basin, it is possible to infer an approximate estimate of the free-energy barrier separating reactants from products (at 650 K) as 67 ± 6 kcal mol−1. Incidentally, the latter value is not that far from the previously estimated free-energy barrier of 62.3 kcal mol−1 obtained within the harmonic approximation of the entropic contributions to the reaction (albeit using a different exchange-correlation functional). The combination of AIMD and MetD is necessary for tracing the mechanistic evolution of the reactions with atomistic precision and allows for, along with committor analysis (Bolhuis et al. 2002), the precise identification of the TSs fully including the entropic contributions. This way, an educative comparison of the TSs estimated by traditional quantum chemistry calculations, on the one hand, and by AIMD + MetD, on the other, has been performed, as shown in Fig. 6.
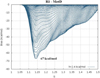 |
Fig. 5. Metadynamics (MetD) bias, in kcal mol−1, necessary for converting, at 650 K, HCHO and HCN into glycolonitrile (reaction (1)). Abscissa S represents the progress of the reaction; S ∼ 1.14 refers to a region of the collective variable (CV) space close to the reactants. As reported in the legend, gaussian heights of 2.4 kcal mol−1 have been deposed every 50 fs of AIMD exploiting the BLYP-D3(BJ) exchange and correlation functional. |
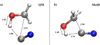 |
Fig. 6. Comparison between the TSs of reaction (1) obtained by means of static quantum mechanical (panel a) and AIMD in conjunction with MetD (panel b) techniques at 650 K. |
3.3.2. Channel 2: HCHO + NH3 → HCONH2 + H2
The same computational protocol employed for reaction (1) has also been used in order to characterize reaction (2), where the conversion of formaldehyde and ammonia into formamide and di-hydrogen was investigated. The Gibbs energy of the reactants (R), the TS, and the products (P) of reaction (2) was thus evaluated through static quantum chemical calculations, as shown in Fig. 7. In contraposition to the results stemming from reaction (1), at all the investigated temperatures the thermochemical data suggest that formamide and H2 are more stable than HCHO and NH3, pointing to a viability of the reaction in the gas phase at all temperatures. Moreover, the higher the temperature is, the more stable are the products with respect to the reactants. In fact, the latter are less stable than the products by 8.7 kcal mol−1, 9.0 kcal mol−1, and 16.5 kcal mol−1 at 300 K, 650 K, and 4500 K, respectively, as shown in Fig. 7. On the other hand, in agreement with the data gathered for reaction (1), an increment of the temperature determines a sizable decrease of the barrier height of the process in kBT units. In particular, whereas the Gibbs energy barrier is 74.4 kcal mol−1 and 79.1 kcal mol−1 at 300 K and 650 K, respectively, an almost double (absolute) barrier (i.e., 143.2 kcal mol−1) characterizes the energy relative to the reactants of the first-order saddle point (i.e., the TS). After the standard rescaling by the kBT factor, indeed, it turns out that the reaction at 300 K is hindered by an energy barrier that is about two and ten times larger than those at 650 K and 4500 K, respectively, similar to reaction (1).
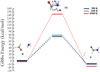 |
Fig. 7. Gibbs energy of reaction (2) determined through the hybrid meta exchange and correlation functional PW6B95 and Grimme’s D3(BJ) dispersion corrections. Some distances (in Å) characterizing the TS are shown. The reaction products become more stable than the reactants at higher temperatures. |
In order to handle with higher accuracy the entropic contributions underlying reaction (2), exploratory AIMD + MetD simulations performed at 650 K allowed us to estimate the finite-temperature free-energy barrier of the process, which is shown in Fig. 8. By deposing gaussian hills of the bias with heights equal to 4.8 kcal mol−1 every 50 fs of AIMD, we found that a free-energy barrier of 88 ± 4 kcal mol−1 has to be overcome in order to convert a gas-phase sample of formaldehyde and ammonia into a sample composed of formamide and di-hydrogen at 650 K. Such an estimate indicates, a posteriori, that albeit not accurate from the entropic treatment standpoint, the energy barrier calculated by means of traditional thermochemistry calculations (i.e., 79.1 kcal mol−1) – at the same (mimicked) temperature – represents a fairly good estimate. Of course, also differences stemming from the use of different exchange-correlation functionals contribute to the difference.
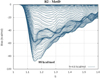 |
Fig. 8. Metadynamics (MetD) bias, in kcal mol−1, necessary for converting, at 650 K, HCHO and NH3 into formamide and H2 (reaction (2)). Abscissa S represents the progress of the reaction; S ∼ 1.15 refers to a region of the CV space close to the reactants. As reported in the legend, gaussian heights of 4.8 kcal mol−1 have been deposed every 50 fs of AIMD exploiting the BLYP-D3(BJ) exchange and correlation functional. |
On the other hand, the great advantage in employing AIMD techniques in conjunction with MetD methods is represented by the possibility of tracing the atomistic evolution of the chemical transformation (i.e., the reaction pathway). From our AIMD + MetD simulations, when no constraints are imposed on the possibility to visit the CV space, it turned out that the system tends to pass through an intermediate basin corresponding to aminomethanol. The latter situation has not been predicted by traditional quantum chemistry simulations. However, in order to have a one-to-one comparison with the TS that emerges from such calculations, we also decided to impose a constraint on the accessible portions of the CV space. This way, the direct conversion of the reactants into the products of reaction (2) (i.e., without the inclusion of the aminomethanol intermediate basin) was reproduced by means of AIMD + MetD, mimicking the result of the quantum chemical calculation. Then, a further committor analysis led us to find the most plausible TS structure, which we compare in Fig. 9 with that stemming from quantum mechanical calculations.
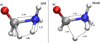 |
Fig. 9. Comparison between the TSs of reaction (2) obtained by means of static Quantum Mechanical (panel a) and AIMD in conjunction with MetD (panel b) techniques at 650 K. |
4. Formaldehyde in environments of early planets
As mentioned in the Introduction, the analysis of trace elements of ancient zircons indicates a trend of decreasing oxygen fugacity more than 3.6 Gyr ago, suggesting that the early atmosphere was reducing (Yang et al. 2014). Based on astrochemical studies and the analysis of interplanetary matter, we can expect the presence of simple molecules (Hashimoto et al. 2007) such as CO, NH3, CO2, H2O, HCN, HCHO, CH3OH, and maybe HCONH2 (Brucato et al. 2006) together with complex substances such as polymers (tholins) (Khare et al. 1994), various organic compounds, and also biomolecules themselves due to impact delivery or transformation of early planetary chemical environments (Chyba & Sagan 1992; Chyba et al. 1990; Schaefer & Fegley 2007; Hazen & Sverjensky 2010).
In the atmosphere of modern Earth, HCHO is formed largely by the decomposition of isoprene and other large biogenic compounds (Palmer et al. 2003). HCHO is not efficiently formed abiotically in oxygen-rich atmospheres, owing largely to the UV protection afforded by the ozone layer. In N2/CO2/CO/CH4 dominated atmospheres, there is no such ozone layer, and CO2, CH4, and H2O can be photodissociated within the troposphere. HCHO is formed from the photochemical products in trace amounts, and HCHO itself is readily photodissociated. These competing processes result in quantities of atmospheric HCHO concentrations on the order of 0.1–10 ppbv. HCHO is readily absorbed into rainwater (Palmer et al. 2003), with a Henry’s Law constant of 104–105 and, assuming that HCHO remains relatively stable within water over million-year timescales, means that rainout of HCHO may lead to concentrated solutions of HCHO and its polymers on the surface. HCHO is formed by the photodissociation of either CO2 or CH4, and is not formed efficiently without at least one of these two gases. In a one bar atmosphere composed of 1000 ppm H2 and H2O at vapor pressure, HCHO is formed from CO2 by the following photochemical pathway (Palmer et al. 2003):
 (3)
(3)
 (4)
(4)
 (5)
(5)
 (6)
(6)
When we consider the production of formaldehyde using the ARGO 1D model with the STAND2018 network (Ardaseva et al. 2017), we do not find that the photodissociation of water is very efficient in the troposphere in comparison to the oxidation of H2, but this may depend on the amount of H2 assumed to be present in the atmosphere of the early Earth. In the absence of CO2, there is no efficient source of atomic oxygen, and there is therefore a lack of atomic hydrogen needed to protonate CO. It turns out that CH4 provides an alternative route to the HCHO formation via methanol:
 (7)
(7)
 (8)
(8)
 (9)
(9)
 (10)
(10)
In both cases, HCHO is destroyed by HCHO + hv → CO + H2. When atomic oxygen arises from CO2 photodissociation, an additional pathway to destroying HCHO opens up (i.e., HCHO + •O → HCO • + • OH); and since the HCO• radical when it reacts with itself can also form 2CO + H2, the destruction is not part of a closed loop back to HCHO. Since in the case of a CO/CH4 dominated atmosphere there is no destruction of HCHO by O, and the formation of HCHO by photodissociating methane is more efficient, the trace abundances of HCHO are predicted to be about an order of magnitude higher in a CH4/CO dominated atmosphere than in a CO/CO2 dominated atmosphere, and so the timescale for rainout and concentration of HCHO would be about one order of magnitude shorter, or on the order of 105 years.
5. Synthesis based on HCHO impact plasma reprocessing
As shown in the previous section, formaldehyde can be produced by photochemical processes in a planetary atmosphere on trace levels. Extraterrestrial delivery therefore remains the main source of formaldehyde on young planets. In such a case, we can expect plasma reprocessing of this molecule. On surfaces including clays, porous basalt, or metal oxides such as titanium dioxide, we expect a rich chemistry leading to the synthesis of the major building blocks of life. In fact, we observed the formation of biomolecules only in experiments involving porous minerals or on the rocks listed below. This chemistry can therefore take place on the surface of the descending body, when formed compounds are sprayed during disintegration, on dust released from the descending body, or on a planetary surface exposed to impact plasma. Further analyses, executed by means of GC-MS, show that all the canonical nucleobases and glycine (i.e., the simplest amino acid) have also been synthesized in our laser-induced fireball experiments. A description of the experiments is supplied in Table 2.
Detection of prebiotic molecules in experiments with treatment of formaldehyde by electric discharge in the presence of nitrogen and by laser-induced dielectric breakdown plasma induced in a nitrogen atmosphere upon formaldehyde solution in water in the presence of montmorillonite clay, titania (TiO2), and basaltic rock.
Our results clearly show that the plasma chemistry of formaldehyde in a nitrogen atmosphere leads to the major building blocks of the RNA world, such as the nucleobases adenine, guanine, uracil, and cytosine, as well as to the formation of ribose and other sugars proven in our previous studies (Civis et al. 2016b). Moreover, we have demonstrated that formamide might not necessarily have played the role of starting prebiotic compound delivered from the extra planetary environments, but it could also serve as an intermediate (maybe also cumulated in the environment) produced, for example, in the plasma chemistry (hypervelocity impacts or electric discharges) in mixtures such as Miller-like CO + NH3 + H2O or, as shown here, from far more abundant amounts of formaldehyde. In addition, a recent work published by Sleep (Sleep 2018) suggests that all the formamide-based origin of life scenarios, including that assuming accumulation of formamide in concentrated form as well as that working with diluted aqueous solutions, are highly plausible on early Earth. Our previous study (Ferus et al. 2017a), as well as the spectroscopic survey of the gas phase presented in Fig. 1, additionally shows that in a laser-induced breakdown simulation of an asteroid impact, the formation of large amounts of hydrogen cyanide should also be expected. Besides, the presented quantum-based molecular dynamics simulations clearly show that HCN may participate in the formation of glycolonitrile through reaction (1).
6. Significance for prebiotic chemistry
Our findings, in combination with some evidence gathered during the past two decades, show that the mechanism of prebiotic synthesis heads toward a chemistry of either hydrogen cyanide or formamide, and that these synthetic routes are mutually interconnected. In general, it has been established that the one-pot synthesis of molecules relevant to prebiotic chemistry (sugars, nucleobases, nucleosides, and amino acids) under various conditions such as thermolysis (Saladino et al. 2013), UV irradiations (Senanayake & Idriss 2006), proton irradiation (Ferus et al. 2015b; Saladino et al. 2015, 2017), or plasma chemistry starting with simple compounds and ending with biomolecular building blocks, does not exhibit yields comparable with step by step mechanisms demonstrated by Sutherland et al. (Sutherland 2016). On the other hand, for example the one-pot proton irradiation-initiated formation of ribo- and 2′-deoxyribonucleosides from sugars and purine nucleobases approaches yields of 20% (Saladino et al. 2017) and a recent paper (Becker et al. 2016) shows that the condensation of formamidopyrimidines (FaPys) with sugars provides the natural N-9 nucleosides with extreme regioselectivity and in good yields (60%). Importantly, the FaPys are available from simple precursors: formic acid and aminopyrimidines, which are available from prebiotic molecules that were also detected during the Rosetta comet mission.
However, different conditions are required for each phase, and therefore such synthesis cannot run in a one-pot fashion like the formation of biomolecules initiated, for example, by an asteroid impact. We have shown that all the canonical nucleobases – together with the simplest amino acid glycine – are synthesized from these molecules in high-energy plasma chemistry, notably from starting mixtures composed of NH3+CO, CH4+N2+H2O, HCOHN2, or HCHO, as inter alia here demonstrated. The early and heavy bombardment represents a significantly long period of the early Earth’s history (i.e., about 300 million years; Nesvorny & Morbidelli 2012; Koeberl 2006; Geiss & Rossi 2013; Morbidelli et al. 2012. Impact-induced synthesis therefore does not represent a single event, but a continuing process with a significant impact on the planetary environment over geological timescales. A series of impact events could form deposits of prebiotic feedstock molecules (as shown here, formamide, glycolaldehyde) or serve as a source of prebiotic molecules undergoing further processes (directly sugars, nucleobases, and glycine). One-pot low-yield chemistry needs a final step, which lies in the concentration of the parent molecules as well as products. In the case of formamide produced by impact reprocessing of HCHO, concentration is due to its very high boiling point, for example, in periodically dried lagoons at the sea coasts. Recent prebiotic models also suggest (Sponer et al. 2016; Cassone et al. 2017c) possible accumulation of formamide via the thermal dissociation of ammonium formate at 180°C near some volcanoes. Under these conditions, formamide forms as a liquid, while water is immediately evaporated.
7. Conclusions
In this study, laboratory simulations of the high-velocity impact of extraterrestrial bodies into planetary atmospheres have been performed with a focused beam of the high power kJ-class laser system. In particular, the reaction network of formaldehyde – in a nitrogen atmosphere – arising upon exposure to such high-density-energy events has been identified, with a special focus on the formation of prebiotically relevant precursors. In fact, the formation of the key intermediate molecule formamide has been observed during those experiments. As quantitatively evaluated by traditional quantum chemical calculations and ab initio molecular dynamics coupled with advanced metadynamics simulations, here synergistically exploited in a complementary fashion, the conversion of formaldehyde into formamide is thermodynamically plausible under such extreme conditions.
From the formamide synthesis, the further chemical evolution of the sample subjected to the impact develops toward the formation of more complex molecules, which are intimately related to the onset of life on early Earth or on Earth-like planets. Indeed, besides the formation of a variety of unstable radicals and simple molecular species such as formic acid, the plasma-induced chemistry leads to the synthesis of other prebiotic molecules such as AHAN and AHMN. Even more interestingly, here we demonstrate that the reaction network of a sample composed of formaldehyde and nitrogen-bearing species subjected to conditions typical of impact events leads to the onset of biologically relevant entities. Indeed, the one-pot synthesis of all the canonical nucleobases of the simplest amino acid (i.e., glycine), and of the sugar ribose has been observed. To summarize, not only the chemical pathways and the thermodynamics of the first steps from formaldehyde toward chemical complexity have been here disclosed by combining standard, static, quantum chemistry calculations and more recent ab initio molecular dynamics simulations coupled with enhanced sampling techniques, but we have also experimentally demonstrated the one-pot formation of all the nucleobases, of glycine, and of ribose from formaldehyde- and nitrogen-containing samples under impact shock conditions. This way, we have shown not only that the chemistries of formaldehyde and formamide may be interconnected but also that both parent molecules may serve as precursors of the main building blocks for the subsequent formation of informational polymers and – ultimately – of life.
Acknowledgments
This work is part of a research series funded by the Czech Science Foundation (grants no. 17-05076S and 18-20609S), and ERDF/ESF “Centre of Advanced Applied Sciences” (No. CZ.02.1.01/0.0/0.0/16019/0000778).
References
- Abelson, P. H. 1956, Science, 124, 935 [CrossRef] [Google Scholar]
- Adam, Z. R., Hongo, Y., Cleaves, II., H. J., et al. 2018, Sci Rep., 8, 165 [NASA ADS] [CrossRef] [Google Scholar]
- Adande, G. R., Woolf, N. J., & Ziurys, L. M. 2013, Astrobiology, 13, 439 [NASA ADS] [CrossRef] [Google Scholar]
- Al-Edhari, A. J., Ceccarelli, C., Kahane, C., et al. 2017, A&A, 597, A40 [NASA ADS] [CrossRef] [EDP Sciences] [Google Scholar]
- Ardaseva, A., Rimmer, P. B., Waldmann, I., et al. 2017, MNRAS, 470, 187 [NASA ADS] [CrossRef] [Google Scholar]
- Barks, H. L., Buckley, R., Grieves, G. A., et al. 2010, ChemBioChem, 11, 1240 [CrossRef] [Google Scholar]
- Becke, A. D. 1988, Phys. Rev. A, 38, 3098 [Google Scholar]
- Becker, S., Thoma, I., Deutsch, A., et al. 2016, Science, 352, 833 [NASA ADS] [CrossRef] [Google Scholar]
- Bell, E. A., Boehnke, P., Harrison, T. M., & Mao, W. L. 2015, Proc. Natl. Acad. Sci. USA, 112, 14518 [NASA ADS] [CrossRef] [Google Scholar]
- Berezhnoy, A. A., & Borovicka, J. 2010, Icarus, 210, 150 [NASA ADS] [CrossRef] [Google Scholar]
- Bernstein, M. P., Sandford, S. A., Allamandola, L. J., et al. 1995, ApJ, 454, 327 [NASA ADS] [CrossRef] [Google Scholar]
- Bockelee-Morvan, D., Lis, D. C., Wink, J. E., et al. 2000, A&A, 353, 1101 [NASA ADS] [Google Scholar]
- Bolhuis, P. G., Chandler, D., Dellago, C., & Geissler, P. L. 2002, Annu. Rev. Phys. Chem., 53, 291 [NASA ADS] [CrossRef] [PubMed] [Google Scholar]
- Borovicka, J., & Berezhnoy, A. A. 2016, Icarus, 278, 248 [NASA ADS] [CrossRef] [Google Scholar]
- Botta, L., Bizzarri, B. M., Piccinino, D., et al. 2017, Eur. Phys. J. Plus, 132, 317 [CrossRef] [Google Scholar]
- Branduardi, D., Gervasio, F. L., & Parrinello, M. 2007, J. Chem. Phys., 126, 54103 [NASA ADS] [CrossRef] [PubMed] [Google Scholar]
- Brucato, J. R., Baratta, G. A., & Strazzulla, G. 2006, A&A, 455, 395 [NASA ADS] [CrossRef] [EDP Sciences] [Google Scholar]
- Bussi, G., Donadio, D., & Parrinello, M. 2007, J. Chem. Phys., 126, 14101 [CrossRef] [PubMed] [Google Scholar]
- Camacho, J. J., Diaz, L., Santos, M., et al. 2008, J. Phys. D, 41, 40037178 [Google Scholar]
- Cassone, G., Pietrucci, F., Saija, F., et al. 2017a, Chem. Sci., 8, 2329 [CrossRef] [Google Scholar]
- Cassone, G., Pietrucci, F., Saija, F., et al. 2017b, Sci. Rep., 7, 6901 [NASA ADS] [CrossRef] [Google Scholar]
- Cassone, G., Sponer, J., Saija, F., et al. 2017c, Phys. Chem. Chem. Phys., 19, 1817 [CrossRef] [Google Scholar]
- Cassone, G., Saija, F., Sponer, J., et al. 2018a, ApJL, 866, L23 [NASA ADS] [CrossRef] [Google Scholar]
- Cassone, G., Sponer, J., Sponer, J. E., et al. 2018b, Chem. Commun., 54, 3211 [CrossRef] [Google Scholar]
- Chyba, C., & Sagan, C. 1992, Nature, 355, 125 [NASA ADS] [CrossRef] [PubMed] [Google Scholar]
- Chyba, C. F., Thomas, P. J., Brookshaw, L., & Sagan, C. 1990, Science, 249, 366 [NASA ADS] [CrossRef] [Google Scholar]
- Civis, S., Babankova, D., Cihelkat, J., et al. 2008, J. Phys. Chem. A, 112, 7162 [CrossRef] [Google Scholar]
- Civis, S., Ferus, M., Kubelik, P., et al. 2012a, A&A, 532, A35 [NASA ADS] [CrossRef] [EDP Sciences] [Google Scholar]
- Civis, S., Ferus, M., Kubelik, P., et al. 2012b, A&A, 535, A61 [NASA ADS] [CrossRef] [EDP Sciences] [Google Scholar]
- Civis, S., Ferus, M., Kubelik, P., et al. 2012c, J. Opt. Soc. Am., 29, 1112 [Google Scholar]
- Civis, S., Kubelik, P., & Ferus, M. 2012d, J. Phys. Chem. A, 116, 3137 [CrossRef] [Google Scholar]
- Civis, S., Ferus, M., Zukalova, M., et al. 2013, Opt. Mater., 36, 159 [NASA ADS] [CrossRef] [Google Scholar]
- Civis, S., Szabla, R., Szyja, B. M., et al. 2016a, Sci. Rep., 6, 23199 [NASA ADS] [CrossRef] [Google Scholar]
- Civis, S., Ferus, M., Knízek, A., et al. 2016b, Phys. Chem. Chem. Phys., 18, 27317 [CrossRef] [Google Scholar]
- Civis, S., Knízek, A., Ivanek, O., et al. 2017, Nat. Astron., 1, 721 [NASA ADS] [CrossRef] [Google Scholar]
- Cleaves, II., H. J. 2008, Precambrian Res., 164, 111 [NASA ADS] [CrossRef] [Google Scholar]
- Cohen, R. J. 1984, MNRAS, 208, 101 [NASA ADS] [CrossRef] [Google Scholar]
- Cooper, G., Kimmich, N., Belisle, W., et al. 2001, Nature, 414, 879 [NASA ADS] [CrossRef] [PubMed] [Google Scholar]
- Dodd, M. S., Papineau, D., Greene, T., et al. 2017, Nature, 543, 60 [NASA ADS] [CrossRef] [Google Scholar]
- Downes, D., & Wilson, T. L. 1974, ApJ, 191, L77 [NASA ADS] [CrossRef] [Google Scholar]
- Ferus, M., Cihelka, J., & Civis, S. 2008, Chem. List., 102, 417 [Google Scholar]
- Ferus, M., Kubelik, P., & Civis, S. 2011a, J. Phys. Chem. A, 115, 12132 [CrossRef] [Google Scholar]
- Ferus, M., Kubelik, P., Kawaguchi, K., et al. 2011b, J. Phys. Chem. A, 115, 1885 [CrossRef] [Google Scholar]
- Ferus, M., Civis, S., Mladek, A., et al. 2012, J. Am. Chem. Soc., 134, 20788 [CrossRef] [Google Scholar]
- Ferus, M., Knizek, A., Civis, S., et al. 2015a, Proc. Natl. Acad. Sci. USA, 112, 7109 [Google Scholar]
- Ferus, M., Nesvorný, D., Sponer, J., et al. 2015b, Proc. Natl. Acad. Sci. USA, 112, 657 [Google Scholar]
- Ferus, M., Kubelík, P., Knízek, A., et al. 2017a, Sci. Rep., 7, 6275 [NASA ADS] [CrossRef] [Google Scholar]
- Ferus, M., Pietrucci, F., Saitta, A. M., et al. 2017b, Proc. Natl. Acad. Sci. USA, 114, 4306 [Google Scholar]
- Ferus, M., Laitl, V., Knizek, A., et al. 2018, A&A, 616, A150 [NASA ADS] [CrossRef] [EDP Sciences] [Google Scholar]
- Forster, J. R., Goss, W. M., Dickel, H. R., & Habing, H. J. 1981, MNRAS, 197, 513 [NASA ADS] [CrossRef] [Google Scholar]
- Fox, S. W., & Windsor, C. R. 1971, Science, 174, 1040 [CrossRef] [Google Scholar]
- Frank, N. 2012, Wiley Interdiscip. Rev. Comput. Mol. Sci., 2, 73 [CrossRef] [Google Scholar]
- Geiss, J., & Rossi, A. P. 2013, Astron. Astrophys. Rev., 21, 1 [CrossRef] [Google Scholar]
- Gilbert, W. 1986, Nature, 319, 618 [NASA ADS] [CrossRef] [Google Scholar]
- Goedecker, S., Teter, M., & Hutter, J. 1996, Phys. Rev. B, 54, 1703 [NASA ADS] [CrossRef] [Google Scholar]
- Goesmann, F., Rosenbauer, H., Bredehoeft, J. H., et al. 2015, Science, 349, 6247 [CrossRef] [Google Scholar]
- Grimme, S., Antony, J., Ehrlich, S., & Krieg, H. 2010, J. Chem. Phys., 132, 154104 [NASA ADS] [CrossRef] [PubMed] [Google Scholar]
- Grimme, S., Ehrlich, S., & Goerigk, L. 2011, J. Comput. Chem., 32, 1456 [Google Scholar]
- Halfen, D. T., Apponi, A. J., Woolf, N., et al. 2006, ApJ, 639, 237 [NASA ADS] [CrossRef] [Google Scholar]
- Hashimoto, G. L., Abe, Y., & Sugita, S. 2007, J. Geophys. Res., 112, E05010 [Google Scholar]
- Hazen, R. M., & Sverjensky, D. A. 2010, Cold Spring Harb Perspect Biol., 2, a002162 [CrossRef] [Google Scholar]
- Hoerst, S. M., Yelle, R. V., Buch, A., et al. 2012, Astrobiology, 12, 809 [NASA ADS] [CrossRef] [Google Scholar]
- Hutter, J., Iannuzzi, M., Schiffmann, F., & VandeVondele, J. 2014, Wiley Interdiscip. Rev. Comput. Mol. Sci., 4, 15 [CrossRef] [Google Scholar]
- Jenniskens, P., Laux, C. O., Wilson, M. A., & Shaller, E. L. 2004, Astrobiology, 4, 81 [Google Scholar]
- Jungwirth, K., Cejnarova, A., Juha, L., et al. 2001, Phys. Plasmas, 8, 2495 [NASA ADS] [CrossRef] [Google Scholar]
- Kahane, C., Ceccarelli, C., Faure, A., & Caux, E. 2013, ApJ, 763, L38 [Google Scholar]
- Khare, B. N., Sagan, C., Thomson, W. R., et al. 1994, Rev. Can. Chim., 72, 678 [NASA ADS] [CrossRef] [Google Scholar]
- Koeberl, C. 2006, Elements, 2, 211 [CrossRef] [Google Scholar]
- Kuwahara, H., & Sugita, S. 2015, Icarus, 257, 290 [NASA ADS] [CrossRef] [Google Scholar]
- Laio, A., & Parrinello, M. 2002, Proc. Natl. Acad. Sci. USA, 99, 12562 [NASA ADS] [CrossRef] [PubMed] [Google Scholar]
- Lazcano, A., & Bada, J. L. 2003, Orig. Life Evol. Biosph., 33, 235 [NASA ADS] [CrossRef] [Google Scholar]
- Lee, C., Yang, W., & Parr, R. G. 1988, Phys. Rev. B, 37, 785 [Google Scholar]
- Mangum, J. G., Wootten, A., Loren, R. B., & Wadiak, E. J. 1990, ApJ, 348, 542 [NASA ADS] [CrossRef] [Google Scholar]
- Manion, J. A., Huie, R. E., & Levin, R. D. 2015, Kinetic Database. In: NIST Chem. Kinet. Database, NIST Stand. Ref. Database 17, Version 7.0 (Web Version), Release 1.6.8, Data, Natl. Inst. Stand. Technol. Gaithersburg, Maryland, 20899 [Google Scholar]
- Martins, Z. 2011, Elements, 7, 35 [CrossRef] [Google Scholar]
- Martins, Z., Botta, O., Fogel, M. L., et al. 2008, Earth Planet Sci. Lett., 270, 130 [NASA ADS] [CrossRef] [Google Scholar]
- Martins, Z., Modica, P., Zanda, B., & D’Hendecourt, L. L. S. 2015, Meteorit. Planet. Sci., 50, 926 [NASA ADS] [CrossRef] [Google Scholar]
- Menor-Salvan, C., & Marin-Yaseli, M. R. 2012, Chem. Soc. Rev., 41, 5404 [CrossRef] [Google Scholar]
- Miller, S. L. 1953, Science, 117, 528 [NASA ADS] [CrossRef] [PubMed] [Google Scholar]
- Miyakawa, S., Yamanashi, H., Kobayashi, K., et al. 2002, Proc. Natl. Acad. Sci. USA, 99, 14628 [NASA ADS] [CrossRef] [Google Scholar]
- Mojzsis, S. J., Arrhenius, G., McKeegan, K. D., et al. 1996, Nature, 384, 55 [NASA ADS] [CrossRef] [Google Scholar]
- Morbidelli, A., Marchi, S., Bottke, W. F., & Kring, D. A. 2012, Earth Planet. Sci. Lett., 355, 144 [NASA ADS] [CrossRef] [Google Scholar]
- Nemes, L., Mohai, M., Donko, Z., & Bertoti, I. 2000, Spectrochim. Acta, 56, 761 [NASA ADS] [CrossRef] [Google Scholar]
- Nesvorny, D., & Morbidelli, A. 2012, AJ, 144, 20 [Google Scholar]
- Oberg, K. I. 2016, Chem. Rev., 116, 9631 [Google Scholar]
- Oberg, K. I., Guzman, V. V., Furuya, K., et al. 2015, Nature, 520, 198 [NASA ADS] [CrossRef] [PubMed] [Google Scholar]
- Okabe, H. 1970, J. Chem. Phys., 53, 3507 [NASA ADS] [CrossRef] [Google Scholar]
- Palmer, P. I., Jacob, D. J., Fiore, A. M., et al. 2003, J. Geophys. Res., 108, D6 [Google Scholar]
- Parker, E. T., Zhou, M., Burton, A. S., et al. 2014, Chem. Int. Ed., 53, 8132 [CrossRef] [Google Scholar]
- Pietrucci, F. 2017, Rev. Phys., 2, 32 [CrossRef] [Google Scholar]
- Pietrucci, F., & Saitta, A. M. 2015, Proc. Natl. Acad. Sci. USA, 112, 15030 [NASA ADS] [CrossRef] [Google Scholar]
- Powner, M. W., & Sutherland, J. D. 2011, Phil. Trans. R. Soc., 366, 2870 [CrossRef] [Google Scholar]
- Powner, M. W., Sutherland, J. D., & Szostak, J. W. 2011, Synlett, 14, 1956 [CrossRef] [Google Scholar]
- Raunier, S., Chiavassa, T., Duvernay, F., et al. 2004, A&A, 416, 165 [NASA ADS] [CrossRef] [EDP Sciences] [Google Scholar]
- Rode, B. M. 1999, Peptides, 20, 773 [CrossRef] [Google Scholar]
- Rotelli, L., Trigo-Rodriguez, J. M., Moyano-Cambero, C. E., et al. 2016, Sci. Rep., 6, 38888 [CrossRef] [Google Scholar]
- Rothman, L. S., Gordon, I. E., Babikov, Y., et al. 2013, J. Quant. Spectrosc. Radiat. Transf., 130, 4 [Google Scholar]
- Saitta, A. M., & Saija, F. 2014, Proc. Natl. Acad. Sci. USA, 111, 13768 [NASA ADS] [CrossRef] [Google Scholar]
- Saladino, R., Crestini, C., Costanzo, G., et al. 2001, Med. Chem., 9, 1249 [CrossRef] [Google Scholar]
- Saladino, R., Crestini, C., Ciciriello, F., et al. 2007, Chem. Biodivers., 4, 694 [CrossRef] [Google Scholar]
- Saladino, R., Botta, G., Pino, S., et al. 2012a, Biochimie, 94, 1451 [CrossRef] [Google Scholar]
- Saladino, R., Botta, G., Pino, S., et al. 2012b, Chem. Soc. Rev., 41, 5526 [CrossRef] [Google Scholar]
- Saladino, R., Botta, G., Delfino, M., & Di Mauro, E. 2013, Chem. Eur. J., 19, 16916 [CrossRef] [Google Scholar]
- Saladino, R., Carota, E., Botta, G., et al. 2015, Proc. Natl. Acad. Sci. USA, 112, E2746 [CrossRef] [Google Scholar]
- Saladino, R., Botta, G., Bizzarri, B. M., et al. 2016, Biochem., 55, 2806 [CrossRef] [Google Scholar]
- Saladino, R., Bizzarri, B. M., Botta, L., et al. 2017, Sci Rep., 7, 14709 [NASA ADS] [CrossRef] [Google Scholar]
- Senanayake, S. D., & Idriss, H. 2006, Proc. Natl. Acad. Sci. USA, 103, 1194 [NASA ADS] [CrossRef] [Google Scholar]
- Schaefer, L., & Fegley, B. 2007, Icarus, 186, 462 [NASA ADS] [CrossRef] [Google Scholar]
- Schlesinger, G., & Miller, S. L. 1983, J. Mol. Evol., 19, 383 [NASA ADS] [CrossRef] [Google Scholar]
- Sleep, N. H. 2018, Astrobiology, 18, 1199 [NASA ADS] [CrossRef] [Google Scholar]
- Sponer, J. E., Sponer, J., Novakova, O., et al. 2016, Chem. Eur. J., 22, 3572 [CrossRef] [Google Scholar]
- Strecker, A. 1850, Ann. Chem. Pharm., 1, 27 [Google Scholar]
- Strecker, A. 1854, Ann. Chem. Pharm., 3, 349 [Google Scholar]
- Sutherland, J. D. 2017, Nat. Rev. Chem., 1, 0012 [CrossRef] [Google Scholar]
- Sutherland, J. D. 2016, Angew. Chem. Int. Ed., 55, 104 [CrossRef] [Google Scholar]
- Sponer, J. E., Szabla, R., Góra, R. W., et al. 2016, Phys. Chem. Chem. Phys., 18, 20047 [CrossRef] [Google Scholar]
- Thompson, M. A., Macdonald, G. H., & Millar, T. J. 1999, A&A, 342, 809 [NASA ADS] [Google Scholar]
- Tribello, G. A., Bonomi, M., Branduardi, D., et al. 2014, Comput. Phys. Commun., 185, 604 [NASA ADS] [CrossRef] [Google Scholar]
- Weigend, F. 2006, Phys. Chem. Chem. Phys., 8, 1057 [CrossRef] [Google Scholar]
- Weigend, F., & Ahlrichs, R. 2005, Phys. Chem. Chem. Phys., 7, 3297 [CrossRef] [PubMed] [Google Scholar]
- Xu, J., Tsanakopoulou, M., Magnani, C. J., et al. 2017, Nat. Chem., 9, 303 [CrossRef] [Google Scholar]
- Yang, X., Gaillard, F., & Scaillet, B. 2014, Earth Planet Sci. Lett., 393, 210 [NASA ADS] [CrossRef] [Google Scholar]
- Zahnle, K., Schaefer, L., & Fegley, B. 2010, Cold Spring Harb. Perspect. Biol., 2, a004895 [CrossRef] [Google Scholar]
- Zhao, Y., & Truhlar, D. G. 2005, J. Phys. Chem. A, 109, 5656 [CrossRef] [Google Scholar]
Appendix A: Additional material
A.1. Plasma chemistry network studied by ab initio molecular dynamics, metadynamics, and quantum chemical calculations
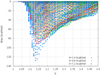 |
Fig. A.1. Metadynamics (MetD) bias, in kcal mol−1, necessary for converting, at 650 K, HCHO and HCN into glycolonitrile (reaction (1)). As reported in the legend, red crosses, green crosses, and blues asterisks correspond to simulations conducted by deposing gaussian heights of the bias equal to 2.4, 4.8, and 7.2 kcal mol−1, respectively. Since the simulation employing heights equal to 2.4 kcal mol−1 was “slow” enough (yielding a bias profile similar to the choice 4.8 kcal mol−1), such a value has been chosen in order to repeat, three additional times, reaction (1) by means of AIMD + MetD techniques. |
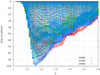 |
Fig. A.2. Metadynamics (MetD) bias, in kcal mol−1, necessary for converting, at 650 K, HCHO and NH3 into formamide and H2 (reaction (2)). Data points represent the bias deposed in the reactants portion of the collective variables space referred to three parallel simulations performed by employing gaussian heights equal to 4.8 kcal mol−1. |
A.2. Detection of nucleobases
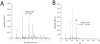 |
Fig. A.3. Uracil detected in the sample from electric discharge cell (methanol extract from the discharge tube) in HCHO mixed with nitrogen. Panel A: chromatogram with the assignment of a corresponding peak of uracil. Panel B: mass spectrum of uracil with retention time t and typical peak at m/z = 283. |
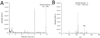 |
Fig. A.4. Adenine detected in the sample from electric discharge cell (methanol extract from the discharge tube) in HCHO mixed with nitrogen. Panel A: chromatogram with the assignment of a corresponding peak of adenine. Panel B: mass spectrum of adenine with retention time t and typical peak at m/z = 306. |
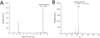 |
Fig. A.5. Guanine detected in the sample from electric discharge cell (methanol extract from the discharge tube) in HCHO mixed with nitrogen. Panel A: chromatogram with the assignment of a corresponding peak of guanine. Panel B: mass spectrum of guanine with retention time t and typical peak at m/z = 322. |
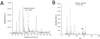 |
Fig. A.6. Cytosine detected in the sample from electric discharge cell (methanol extract from the discharge tube) in HCHO mixed with nitrogen. Panel A: chromatogram with the assignment of a corresponding peak of cytosine. Panel B: mass spectrum of cytosine with retention time t and typical peak at m/z = 282. |
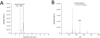 |
Fig. A.7. Glycine detected in the sample from electric discharge cell (methanol extract from the discharge tube) in HCHO mixed with nitrogen. Panel A: chromatogram with the assignment of a corresponding peak of glycine. Panel B: mass spectrum of glycine with retention time t and typical peak at m/z = 246. |
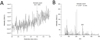 |
Fig. A.8. Uracil detected in the sample of HCHO solution treated with LIDB in the presence of montmorillonite upon nitrogen atmosphere. Panel A: chromatogram with the assignment of a corresponding peak of uracil. Panel B: mass spectrum of uracil with retention time t and typical peak at m/z = 283. |
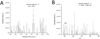 |
Fig. A.9. Adenine detected in the sample of HCHO solution treated with LIDB in the presence of montmorillonite upon nitrogen atmosphere. Panel A: depicts a chromatogram with the assignment of a corresponding peak of adenine. Panel B shows the mass spectrum of adenine with retention time t and typical peak at m/z = 306. |
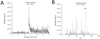 |
Fig. A.10. Guanine detected in the sample of HCHO solution treated with LIDB in the presence of montmorillonite upon nitrogen atmosphere. Panel A: depicts a chromatogram with the assignment of a corresponding peak of guanine. Panel B: mass spectrum of guanine with retention time t and typical peak at m/z = 322. |
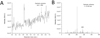 |
Fig. A.11. Cytosine detected in the sample of HCHO solution treated with LIDB in the presence of montmorillonite upon nitrogen atmosphere. Panel A: depicts a chromatogram with the assignment of a corresponding peak of cytosine. Panel B: mass spectrum of cytosine with retention time t and typical peak at m/z = 282. |
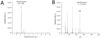 |
Fig. A.12. Glycine detected in the sample of HCHO solution treated with LIDB in the presence of montmorillonite upon nitrogen atmosphere. Panel A: depicts a chromatogram with the assignment of a corresponding peak of glycine. Panel B: mass spectrum of glycine with retention time t and typical peak at m/z = 246. |
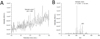 |
Fig. A.13. Uracil detected in the sample of HCHO solution treated with LIDB in the presence of anatase upon nitrogen atmosphere. Panel A: chromatogram with the assignment of a corresponding peak of uracil. Panel B: mass spectrum of uracil with retention time t and typical peak at m/z = 283. |
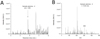 |
Fig. A.14. Adenine detected in the sample of HCHO solution treated with LIDB in the presence of anatase upon nitrogen atmosphere. Panel A: chromatogram with the assignment of a corresponding peak of adenine. Panel B: mass spectrum of adenine with retention time t and typical peak at m/z = 306. |
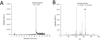 |
Fig. A.15. Guanine detected in the sample of HCHO solution treated with LIDB in the presence of anatase upon nitrogen atmosphere. Panel A: chromatogram with the assignment of a corresponding peak of guanine. Panel B: mass spectrum of guanine with retention time t and typical peak at m/z = 322. |
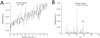 |
Fig. A.16. Cytosine detected in the sample of HCHO solution treated with LIDB in the presence of anatase upon nitrogen atmosphere. Panel A: chromatogram with the assignment of a corresponding peak of cytosine. Panel B: mass spectrum of cytosine with retention time t and typical peak at m/z = 282. |
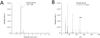 |
Fig. A.17. Glycine detected in the sample of HCHO solution treated with LIDB in the presence of anatase upon nitrogen atmosphere. Panel A: chromatogram with the assignment of a corresponding peak of glycine. Panel B: mass spectrum of glycine with retention time t and typical peak at m/z = 246. |
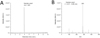 |
Fig. A.18. Uracil detected in the sample of HCHO solution treated with LIDB in the presence of basalt upon nitrogen atmosphere. Panel A: chromatogram with the assignment of a corresponding peak of uracil. Panel B: mass spectrum of uracil with retention time t and typical peak at m/z = 283. |
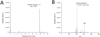 |
Fig. A.19. Adenine detected in the sample of HCHO solution treated with LIDB in the presence of basalt upon nitrogen atmosphere. Panel A: chromatogram with the assignment of a corresponding peak of adenine. Panel B: mass spectrum of adenine with retention time t and typical peak at m/z = 306. |
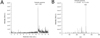 |
Fig. A.20. Guanine detected in the sample of HCHO solution treated with LIDB in the presence of basalt upon nitrogen atmosphere. Panel A: chromatogram with the assignment of a corresponding peak of guanine. Panel B: mass spectrum of guanine with retention time t and typical peak at m/z = 322. |
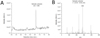 |
Fig. A.21. Cytosine detected in the sample of HCHO solution treated with LIDB in the presence of basalt upon nitrogen atmosphere. Panel A: chromatogram with the assignment of a corresponding peak of cytosine. Panel B: mass spectrum of cytosine with retention time t and typical peak at m/z = 282. |
 |
Fig. A.22. Glycine detected in the sample of HCHO solution treated with LIDB in the presence of basalt upon nitrogen atmosphere. Panel A: chromatogram with the assignment of a corresponding peak of glycine. Panel B: mass spectrum of glycine with retention time t and typical peak at m/z = 246. |
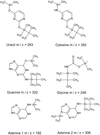 |
Fig. A.23. Structure and typical masses of main fragments of the canonical nucleic bases and glycine after derivatization. |
A.3. Contamination
Regarding possible contamination, we have performed a comparative analysis of blanks. The blanks are compared with a standard chromatogram of 20 ppm of nucleobases diluted in formaldehyde (Fig. A.24, panel A) and with irradion upon a nitrogen atmosphere (panel B). We conducted a reference experiment without irradiation with montmorillonite used as a catalyst (panel C), and we did not detect any one nucleobase. All the results were negative. We also tested nucleobases in water after washing of the vessel touched with fingers without gloves (panel D) and water washed using a montmorillonite catalyst (panel E). We obtained negative results. We show four blank chromatograms. Apart from analyses of blank samples, we would like to note that if any contamination had been caused by biological DNA/RNA, then other compounds, such as ribose, should have been detected. Another argument for the noncontamination is that adenine and uracil, and guanine and cytosine, would have to exhibit comparable concentrations (due to standard A=U and G=C pairing in RNA), which, again, was not observed. Last, but not least, amounts of nucleobases found in the sample imply ng μl−1 concentrations of nucleic acids. Such concentrations are usually observed during standard plasmid DNA extraction and purification from E. coli. It is very difficult to imagine that such a high concentration of nucleic acids was caused by simple contamination.
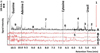 |
Fig. A.24. Chromatograms of blank measurements, all of them with a derivatization agent, together with a chromatogram of standard of 20 ppm of nucleobases for comparison depicted in panel A. Panels B and C: chromatographic record of a cell filled with nitrogen exposed to a plasma and a record of a cell from a laser shock wave experiment not exposed to plasma, both washed with water; panel D: chromatogram of a cell touched with fingers without gloves, and panel E: record of water after washing of a montmorillonite catalyst. Numbers 1–9 mark manifold products of mutual reactions in derivatization agent. |
All Tables
Column density Ntot expressed in cm−2 of formamide and formaldehyde in several interstellar objects and the Halle Bopp comet.
Detection of prebiotic molecules in experiments with treatment of formaldehyde by electric discharge in the presence of nitrogen and by laser-induced dielectric breakdown plasma induced in a nitrogen atmosphere upon formaldehyde solution in water in the presence of montmorillonite clay, titania (TiO2), and basaltic rock.
All Figures
|
Fig. 1. Spectroscopic survey of HCHO + N2 glow electric discharge plasma in spectral ranges of optical and near together with middle ultraviolet emission (panel A), shown in nanometer scale, and middle infrared emission (panel B), shown in cm−1 scale. In this figure, we show appropriate spectral units commonly used in each particular region; corresponding wavenumbers and wavelengths are also illustrated for both spectral ranges. Dominant molecular and radical emission bands belong to •OH, CO, •CH, •CN, N2, CO2, HCN, HNC species (Okabe 1970; Nemes et al. 2000; Camacho et al. 2008; Rothman et al. 2013; Civis et al. 2008, 2016b). Panel C depicts FTIR absorption spectra of discharge products trapped in the liquid nitrogen trap. Besides HCN and CO2, NH3, C2H2, H2O, HCOOH, and N2O molecules are additionally detected. |
| In the text | |
|
Fig. 2. Panel A: reprocessing of HCHO in plasma upon a nitrogen atmosphere. Panel B: further formation of basic substances of the RNA genetic code. Particular reactions indicated in panel A are listed in the database NIST (Manion et al. 2015) whereas formation of biomolecules is described in, for example, Menor-Salvan & Marin-Yaseli (2012). |
| In the text | |
|
Fig. 3. Panel A: high-resolution FTIR absorption spectroscopy survey of formaldehyde treated in the presence of montmorillonite by the action of plasmas formed by laser-induced dielectric breakdown (LIDB). Rectangles B and C: spectral range of AHMN, AHAN, and formamide dimer vibration bands magnified in the panels B and C, respectively. |
| In the text | |
|
Fig. 4. Gibbs energy of reaction (1) determined through the hybrid meta exchange and correlation functional PW6B95 and Grimme’s D3(BJ) dispersion corrections. Some distances (in Å) characterizing the TS are shown. |
| In the text | |
|
Fig. 5. Metadynamics (MetD) bias, in kcal mol−1, necessary for converting, at 650 K, HCHO and HCN into glycolonitrile (reaction (1)). Abscissa S represents the progress of the reaction; S ∼ 1.14 refers to a region of the collective variable (CV) space close to the reactants. As reported in the legend, gaussian heights of 2.4 kcal mol−1 have been deposed every 50 fs of AIMD exploiting the BLYP-D3(BJ) exchange and correlation functional. |
| In the text | |
|
Fig. 6. Comparison between the TSs of reaction (1) obtained by means of static quantum mechanical (panel a) and AIMD in conjunction with MetD (panel b) techniques at 650 K. |
| In the text | |
|
Fig. 7. Gibbs energy of reaction (2) determined through the hybrid meta exchange and correlation functional PW6B95 and Grimme’s D3(BJ) dispersion corrections. Some distances (in Å) characterizing the TS are shown. The reaction products become more stable than the reactants at higher temperatures. |
| In the text | |
|
Fig. 8. Metadynamics (MetD) bias, in kcal mol−1, necessary for converting, at 650 K, HCHO and NH3 into formamide and H2 (reaction (2)). Abscissa S represents the progress of the reaction; S ∼ 1.15 refers to a region of the CV space close to the reactants. As reported in the legend, gaussian heights of 4.8 kcal mol−1 have been deposed every 50 fs of AIMD exploiting the BLYP-D3(BJ) exchange and correlation functional. |
| In the text | |
|
Fig. 9. Comparison between the TSs of reaction (2) obtained by means of static Quantum Mechanical (panel a) and AIMD in conjunction with MetD (panel b) techniques at 650 K. |
| In the text | |
|
Fig. A.1. Metadynamics (MetD) bias, in kcal mol−1, necessary for converting, at 650 K, HCHO and HCN into glycolonitrile (reaction (1)). As reported in the legend, red crosses, green crosses, and blues asterisks correspond to simulations conducted by deposing gaussian heights of the bias equal to 2.4, 4.8, and 7.2 kcal mol−1, respectively. Since the simulation employing heights equal to 2.4 kcal mol−1 was “slow” enough (yielding a bias profile similar to the choice 4.8 kcal mol−1), such a value has been chosen in order to repeat, three additional times, reaction (1) by means of AIMD + MetD techniques. |
| In the text | |
|
Fig. A.2. Metadynamics (MetD) bias, in kcal mol−1, necessary for converting, at 650 K, HCHO and NH3 into formamide and H2 (reaction (2)). Data points represent the bias deposed in the reactants portion of the collective variables space referred to three parallel simulations performed by employing gaussian heights equal to 4.8 kcal mol−1. |
| In the text | |
|
Fig. A.3. Uracil detected in the sample from electric discharge cell (methanol extract from the discharge tube) in HCHO mixed with nitrogen. Panel A: chromatogram with the assignment of a corresponding peak of uracil. Panel B: mass spectrum of uracil with retention time t and typical peak at m/z = 283. |
| In the text | |
|
Fig. A.4. Adenine detected in the sample from electric discharge cell (methanol extract from the discharge tube) in HCHO mixed with nitrogen. Panel A: chromatogram with the assignment of a corresponding peak of adenine. Panel B: mass spectrum of adenine with retention time t and typical peak at m/z = 306. |
| In the text | |
|
Fig. A.5. Guanine detected in the sample from electric discharge cell (methanol extract from the discharge tube) in HCHO mixed with nitrogen. Panel A: chromatogram with the assignment of a corresponding peak of guanine. Panel B: mass spectrum of guanine with retention time t and typical peak at m/z = 322. |
| In the text | |
|
Fig. A.6. Cytosine detected in the sample from electric discharge cell (methanol extract from the discharge tube) in HCHO mixed with nitrogen. Panel A: chromatogram with the assignment of a corresponding peak of cytosine. Panel B: mass spectrum of cytosine with retention time t and typical peak at m/z = 282. |
| In the text | |
|
Fig. A.7. Glycine detected in the sample from electric discharge cell (methanol extract from the discharge tube) in HCHO mixed with nitrogen. Panel A: chromatogram with the assignment of a corresponding peak of glycine. Panel B: mass spectrum of glycine with retention time t and typical peak at m/z = 246. |
| In the text | |
|
Fig. A.8. Uracil detected in the sample of HCHO solution treated with LIDB in the presence of montmorillonite upon nitrogen atmosphere. Panel A: chromatogram with the assignment of a corresponding peak of uracil. Panel B: mass spectrum of uracil with retention time t and typical peak at m/z = 283. |
| In the text | |
|
Fig. A.9. Adenine detected in the sample of HCHO solution treated with LIDB in the presence of montmorillonite upon nitrogen atmosphere. Panel A: depicts a chromatogram with the assignment of a corresponding peak of adenine. Panel B shows the mass spectrum of adenine with retention time t and typical peak at m/z = 306. |
| In the text | |
|
Fig. A.10. Guanine detected in the sample of HCHO solution treated with LIDB in the presence of montmorillonite upon nitrogen atmosphere. Panel A: depicts a chromatogram with the assignment of a corresponding peak of guanine. Panel B: mass spectrum of guanine with retention time t and typical peak at m/z = 322. |
| In the text | |
|
Fig. A.11. Cytosine detected in the sample of HCHO solution treated with LIDB in the presence of montmorillonite upon nitrogen atmosphere. Panel A: depicts a chromatogram with the assignment of a corresponding peak of cytosine. Panel B: mass spectrum of cytosine with retention time t and typical peak at m/z = 282. |
| In the text | |
|
Fig. A.12. Glycine detected in the sample of HCHO solution treated with LIDB in the presence of montmorillonite upon nitrogen atmosphere. Panel A: depicts a chromatogram with the assignment of a corresponding peak of glycine. Panel B: mass spectrum of glycine with retention time t and typical peak at m/z = 246. |
| In the text | |
|
Fig. A.13. Uracil detected in the sample of HCHO solution treated with LIDB in the presence of anatase upon nitrogen atmosphere. Panel A: chromatogram with the assignment of a corresponding peak of uracil. Panel B: mass spectrum of uracil with retention time t and typical peak at m/z = 283. |
| In the text | |
|
Fig. A.14. Adenine detected in the sample of HCHO solution treated with LIDB in the presence of anatase upon nitrogen atmosphere. Panel A: chromatogram with the assignment of a corresponding peak of adenine. Panel B: mass spectrum of adenine with retention time t and typical peak at m/z = 306. |
| In the text | |
|
Fig. A.15. Guanine detected in the sample of HCHO solution treated with LIDB in the presence of anatase upon nitrogen atmosphere. Panel A: chromatogram with the assignment of a corresponding peak of guanine. Panel B: mass spectrum of guanine with retention time t and typical peak at m/z = 322. |
| In the text | |
|
Fig. A.16. Cytosine detected in the sample of HCHO solution treated with LIDB in the presence of anatase upon nitrogen atmosphere. Panel A: chromatogram with the assignment of a corresponding peak of cytosine. Panel B: mass spectrum of cytosine with retention time t and typical peak at m/z = 282. |
| In the text | |
|
Fig. A.17. Glycine detected in the sample of HCHO solution treated with LIDB in the presence of anatase upon nitrogen atmosphere. Panel A: chromatogram with the assignment of a corresponding peak of glycine. Panel B: mass spectrum of glycine with retention time t and typical peak at m/z = 246. |
| In the text | |
|
Fig. A.18. Uracil detected in the sample of HCHO solution treated with LIDB in the presence of basalt upon nitrogen atmosphere. Panel A: chromatogram with the assignment of a corresponding peak of uracil. Panel B: mass spectrum of uracil with retention time t and typical peak at m/z = 283. |
| In the text | |
|
Fig. A.19. Adenine detected in the sample of HCHO solution treated with LIDB in the presence of basalt upon nitrogen atmosphere. Panel A: chromatogram with the assignment of a corresponding peak of adenine. Panel B: mass spectrum of adenine with retention time t and typical peak at m/z = 306. |
| In the text | |
|
Fig. A.20. Guanine detected in the sample of HCHO solution treated with LIDB in the presence of basalt upon nitrogen atmosphere. Panel A: chromatogram with the assignment of a corresponding peak of guanine. Panel B: mass spectrum of guanine with retention time t and typical peak at m/z = 322. |
| In the text | |
|
Fig. A.21. Cytosine detected in the sample of HCHO solution treated with LIDB in the presence of basalt upon nitrogen atmosphere. Panel A: chromatogram with the assignment of a corresponding peak of cytosine. Panel B: mass spectrum of cytosine with retention time t and typical peak at m/z = 282. |
| In the text | |
|
Fig. A.22. Glycine detected in the sample of HCHO solution treated with LIDB in the presence of basalt upon nitrogen atmosphere. Panel A: chromatogram with the assignment of a corresponding peak of glycine. Panel B: mass spectrum of glycine with retention time t and typical peak at m/z = 246. |
| In the text | |
|
Fig. A.23. Structure and typical masses of main fragments of the canonical nucleic bases and glycine after derivatization. |
| In the text | |
|
Fig. A.24. Chromatograms of blank measurements, all of them with a derivatization agent, together with a chromatogram of standard of 20 ppm of nucleobases for comparison depicted in panel A. Panels B and C: chromatographic record of a cell filled with nitrogen exposed to a plasma and a record of a cell from a laser shock wave experiment not exposed to plasma, both washed with water; panel D: chromatogram of a cell touched with fingers without gloves, and panel E: record of water after washing of a montmorillonite catalyst. Numbers 1–9 mark manifold products of mutual reactions in derivatization agent. |
| In the text | |
Current usage metrics show cumulative count of Article Views (full-text article views including HTML views, PDF and ePub downloads, according to the available data) and Abstracts Views on Vision4Press platform.
Data correspond to usage on the plateform after 2015. The current usage metrics is available 48-96 hours after online publication and is updated daily on week days.
Initial download of the metrics may take a while.