Fig. 6.
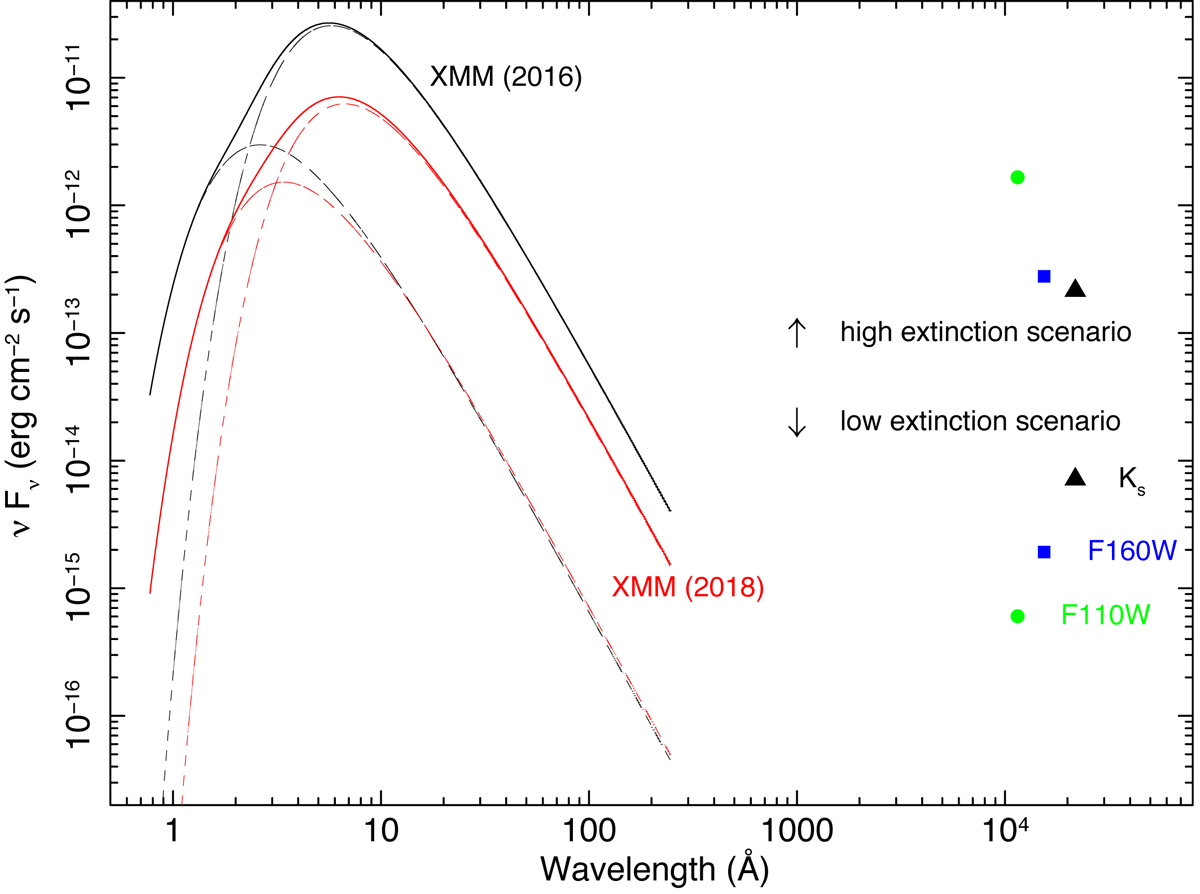
Spectral energy distribution for 1E 1613 from X-rays to near IR. The XMM-Newton spectral models (double blackbody) are plotted in black for the 2016 data and in red for the 2018 data; the two blackbody components are plotted with the same colors and dashed lines. The black triangles indicate the June 2016 VLT values in the case of low and high extinction (AV from 3.6 to 36). The HST points are from Tendulkar et al. (2017) and the exposures were taken in August 2016 (similar values were found earlier, in July 2016).
Current usage metrics show cumulative count of Article Views (full-text article views including HTML views, PDF and ePub downloads, according to the available data) and Abstracts Views on Vision4Press platform.
Data correspond to usage on the plateform after 2015. The current usage metrics is available 48-96 hours after online publication and is updated daily on week days.
Initial download of the metrics may take a while.