Free Access
Fig. 5.
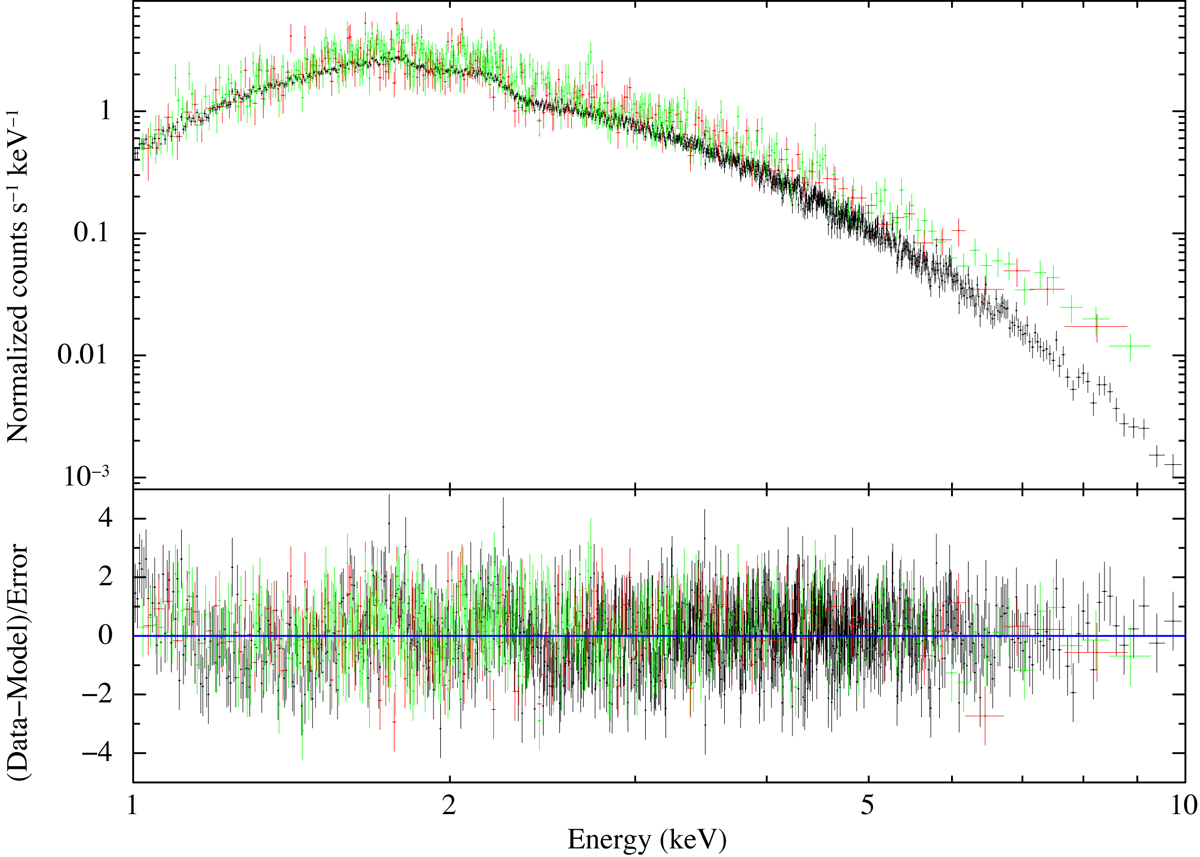
Spectra of the flares (the data of the first are plotted in red, those of the second in green) compared with that of the average emission (in black). The model fit to the data is the double blackbody. For clarity, we plot only the pn points. Bottom: post-fit residuals.
Current usage metrics show cumulative count of Article Views (full-text article views including HTML views, PDF and ePub downloads, according to the available data) and Abstracts Views on Vision4Press platform.
Data correspond to usage on the plateform after 2015. The current usage metrics is available 48-96 hours after online publication and is updated daily on week days.
Initial download of the metrics may take a while.