Fig. 4.
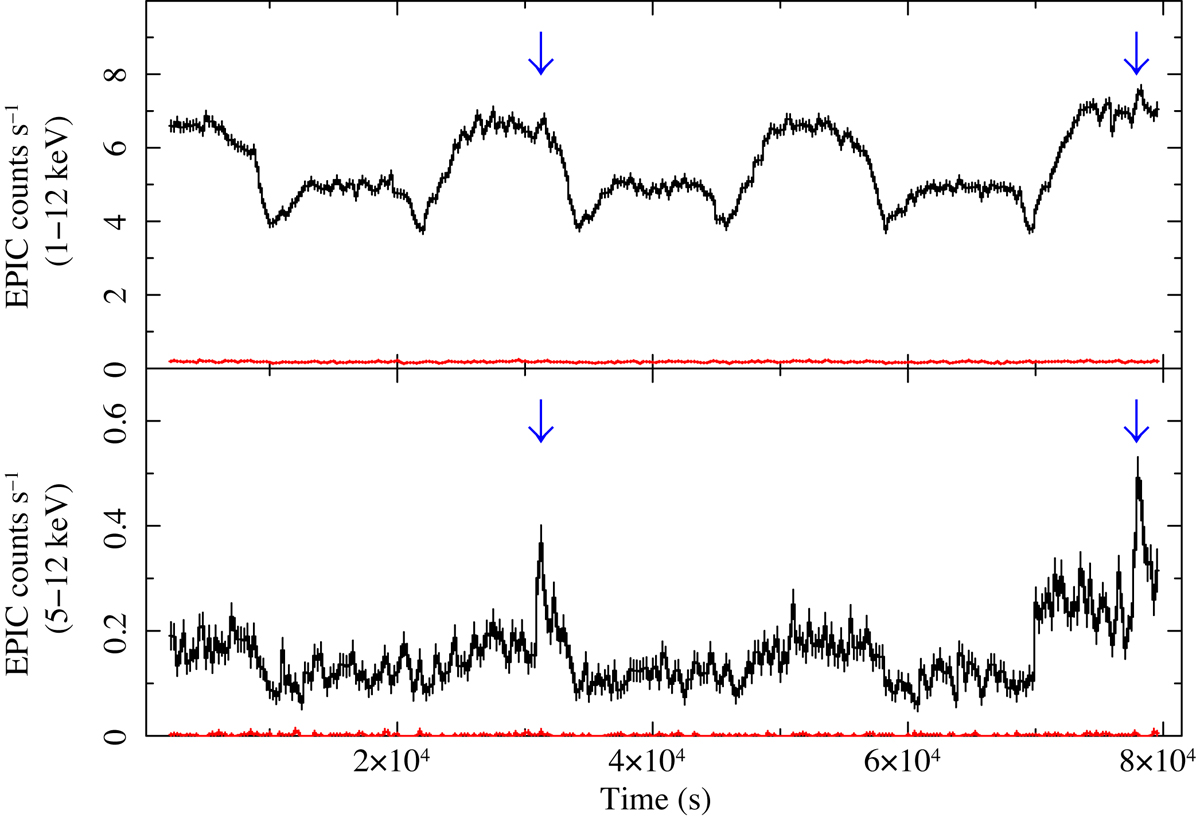
Light curves of 1E 1613 from the 2016 observation (A) in the 1–12 keV range (top) and in a hard band (5–12 keV) (bottom). The time bin is 250 s. The background contribution is negligible and was not subtracted, but the background level in the proper energy band is shown in red in each panel. The arrows indicate the faint flares (more prominent in the hard band) that are discussed in Sect. 3.
Current usage metrics show cumulative count of Article Views (full-text article views including HTML views, PDF and ePub downloads, according to the available data) and Abstracts Views on Vision4Press platform.
Data correspond to usage on the plateform after 2015. The current usage metrics is available 48-96 hours after online publication and is updated daily on week days.
Initial download of the metrics may take a while.