Fig. 3.
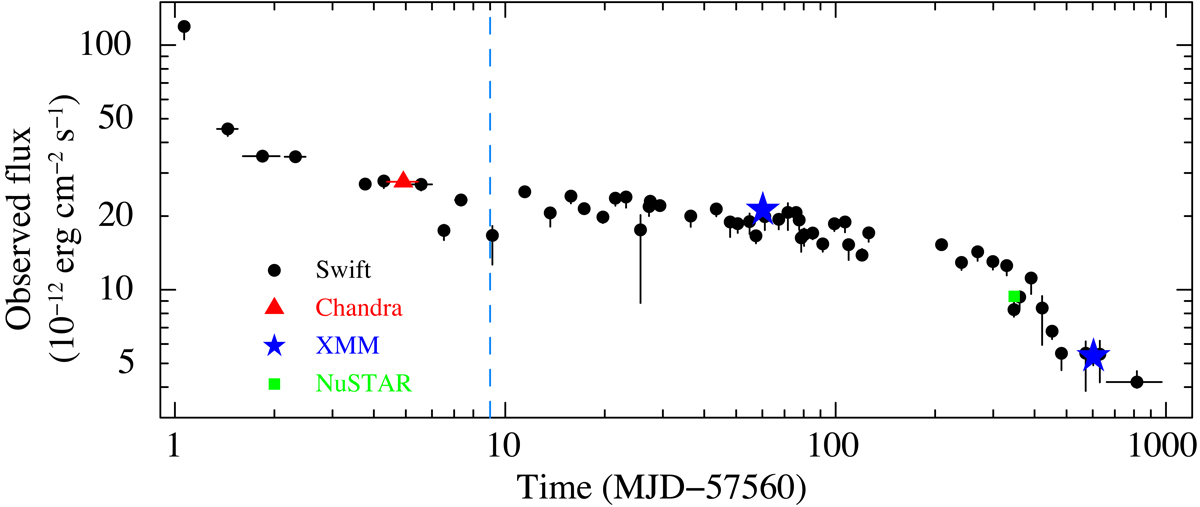
Long-term light curve of 1E 1613 starting from the 2016 burst. The flux (not corrected for the absorption) is in the 0.5–10 keV band. Except for the XMM-Newton points, the data are from the Magnetar Outburst Online Catalog (MOOC, http://magnetars.ice.csic.es/; Coti Zelati et al. 2018) and the flux values were obtained from a double-blackbody fit. For some data points, the error bar is smaller than the symbol. The dashed line indicates the epoch of the VLT observation.
Current usage metrics show cumulative count of Article Views (full-text article views including HTML views, PDF and ePub downloads, according to the available data) and Abstracts Views on Vision4Press platform.
Data correspond to usage on the plateform after 2015. The current usage metrics is available 48-96 hours after online publication and is updated daily on week days.
Initial download of the metrics may take a while.