Fig. 2.
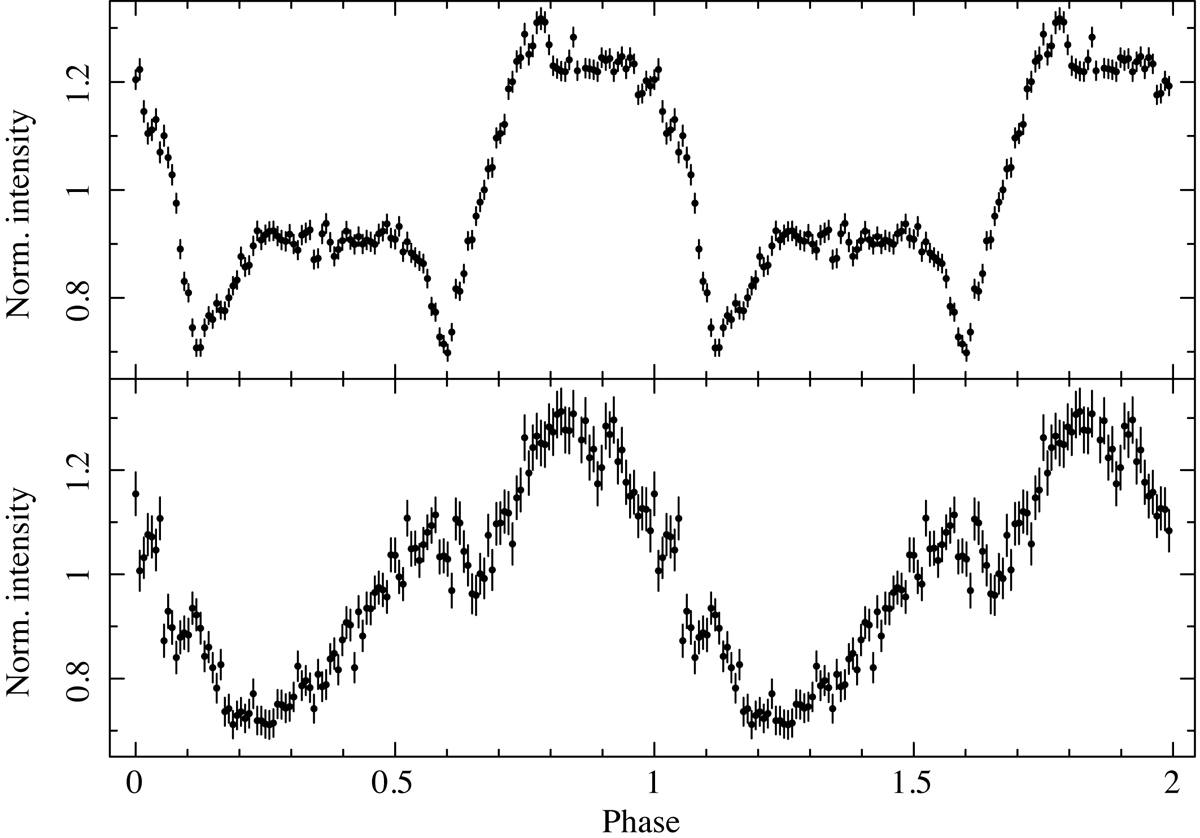
Folded light curves of 1E 1613. Top panel: 2016 data set (A) and bottom panel: 2018 data set (B). The energy range is 1–10 keV, and both data sets were folded with epoch MJD 57619 in the FTOOLS task efold and the period of Esposito et al. (2011, P = 24 030.42 s). The profile apparently evolves from the complex multi-peak structure observed in high flux states to the simpler (nearly sinusoidal) shape observed in quiescence (see Fig. 2 of De Luca et al. 2006, Fig. 3 of Rea et al. 2016, and Fig. 4 of Esposito et al. 2011 for a collection of the pulse profiles that were observed in quiescence).
Current usage metrics show cumulative count of Article Views (full-text article views including HTML views, PDF and ePub downloads, according to the available data) and Abstracts Views on Vision4Press platform.
Data correspond to usage on the plateform after 2015. The current usage metrics is available 48-96 hours after online publication and is updated daily on week days.
Initial download of the metrics may take a while.