Fig. 22.
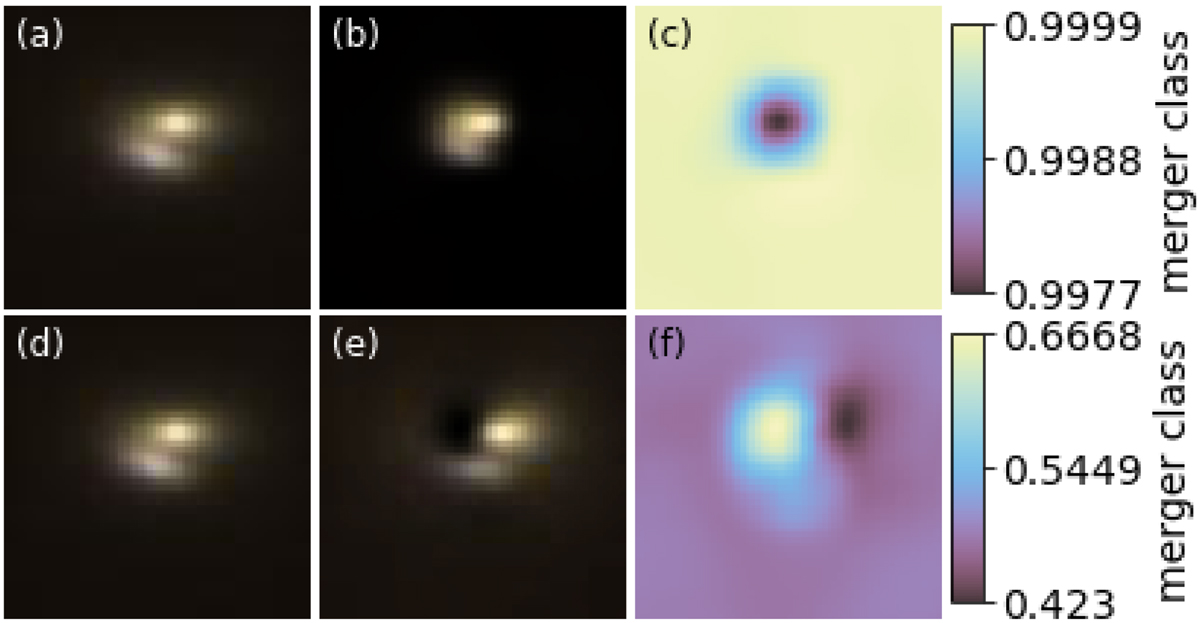
Heat maps to demonstrate how the observation (top row) and simulation (bottom row) networks detect an example merging EAGLE system. Panels a and d: original image of the galaxy being classified. Panels b and e: regions that most effect the merger classification and panels c and f: heat maps where regions with darker colours have a greater affect on the classification (lower merger class output). Panels b and e are created by stretching the heat map between zero and one and multiplying this with the original image.
Current usage metrics show cumulative count of Article Views (full-text article views including HTML views, PDF and ePub downloads, according to the available data) and Abstracts Views on Vision4Press platform.
Data correspond to usage on the plateform after 2015. The current usage metrics is available 48-96 hours after online publication and is updated daily on week days.
Initial download of the metrics may take a while.