Fig. 18.
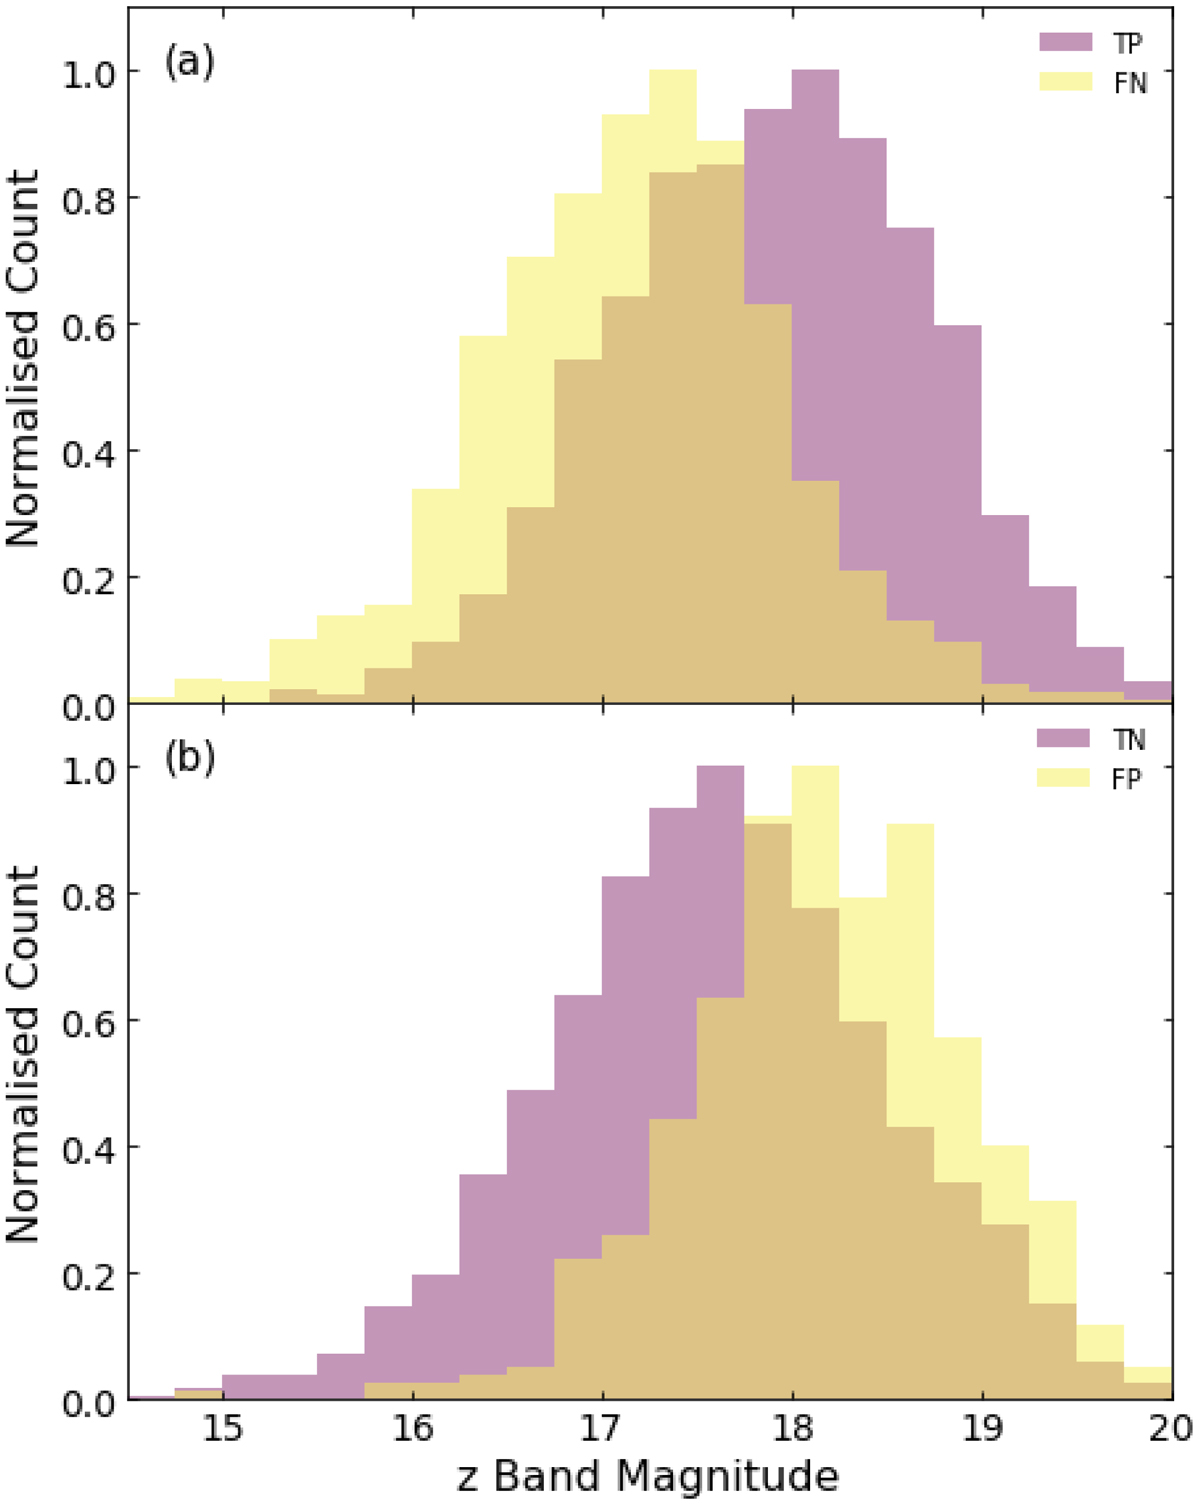
Distributions for the correctly (purple) and incorrectly (yellow) identified SDSS objects after being classified by the simulation network for (a) mergers and (b) non-mergers as a function of z-band magnitude. Bright mergers are preferentially classified as non-mergers while the distribution of misclassified non-mergers is skewed towards the faint end of the distribution. This trend becomes less pronounced as the bands become more blue, from z to u-band.
Current usage metrics show cumulative count of Article Views (full-text article views including HTML views, PDF and ePub downloads, according to the available data) and Abstracts Views on Vision4Press platform.
Data correspond to usage on the plateform after 2015. The current usage metrics is available 48-96 hours after online publication and is updated daily on week days.
Initial download of the metrics may take a while.