Fig. 9
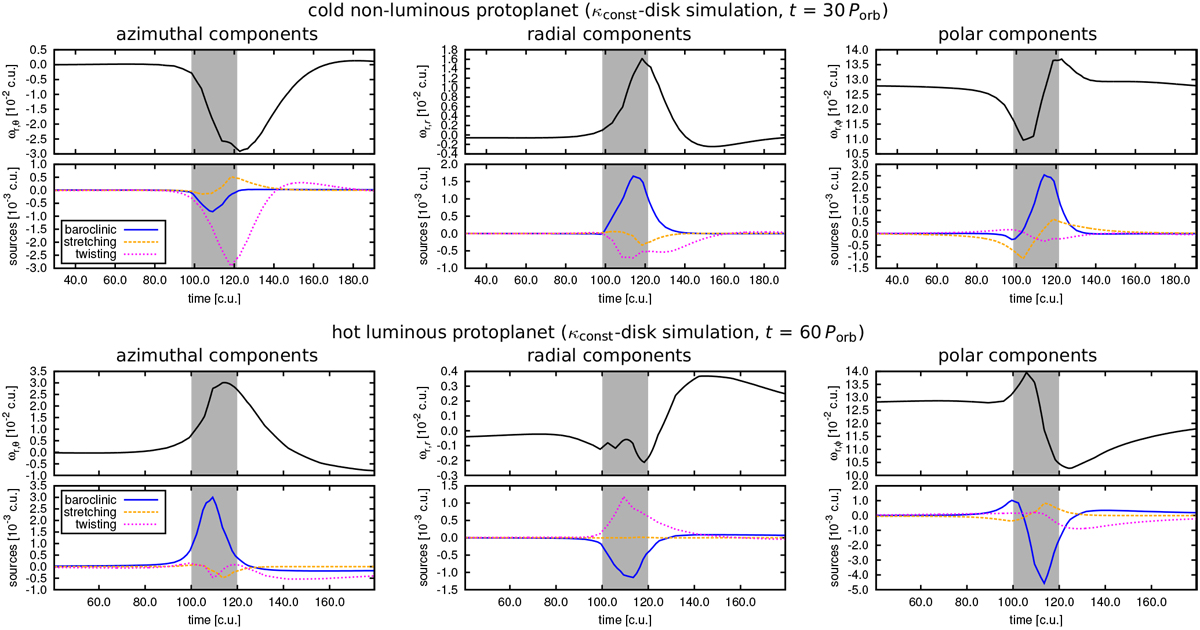
Evolution of the relative vorticity (first and third row) and balance of the vorticity source terms (second and fourth row) along a single streamline in the κconst -disk simulation. The streamlines for these measurements are chosen from the 3D sets displayed in Fig. 5. For the hot protoplanet (bottom two rows) the extremal outer circulating streamline is selected, and for the cold protoplanet (top two rows) we select an outer circulating streamline with a comparable Hill sphere crossing time. Azimuthal (left), radial (middle), and polar (right) components of the vorticity (black solid curve), and the baroclinic term (blue solid curve), stretching term (orange dashed curve), and twisting term (magenta dotted curve) are displayed using scaled code units. The grey rectangle marks the Hill sphere crossing. We point out that the source terms represent the rate of change of the vorticity and also that the vertical range is not kept fixed among individual panels.
Current usage metrics show cumulative count of Article Views (full-text article views including HTML views, PDF and ePub downloads, according to the available data) and Abstracts Views on Vision4Press platform.
Data correspond to usage on the plateform after 2015. The current usage metrics is available 48-96 hours after online publication and is updated daily on week days.
Initial download of the metrics may take a while.