Free Access
Fig. 8
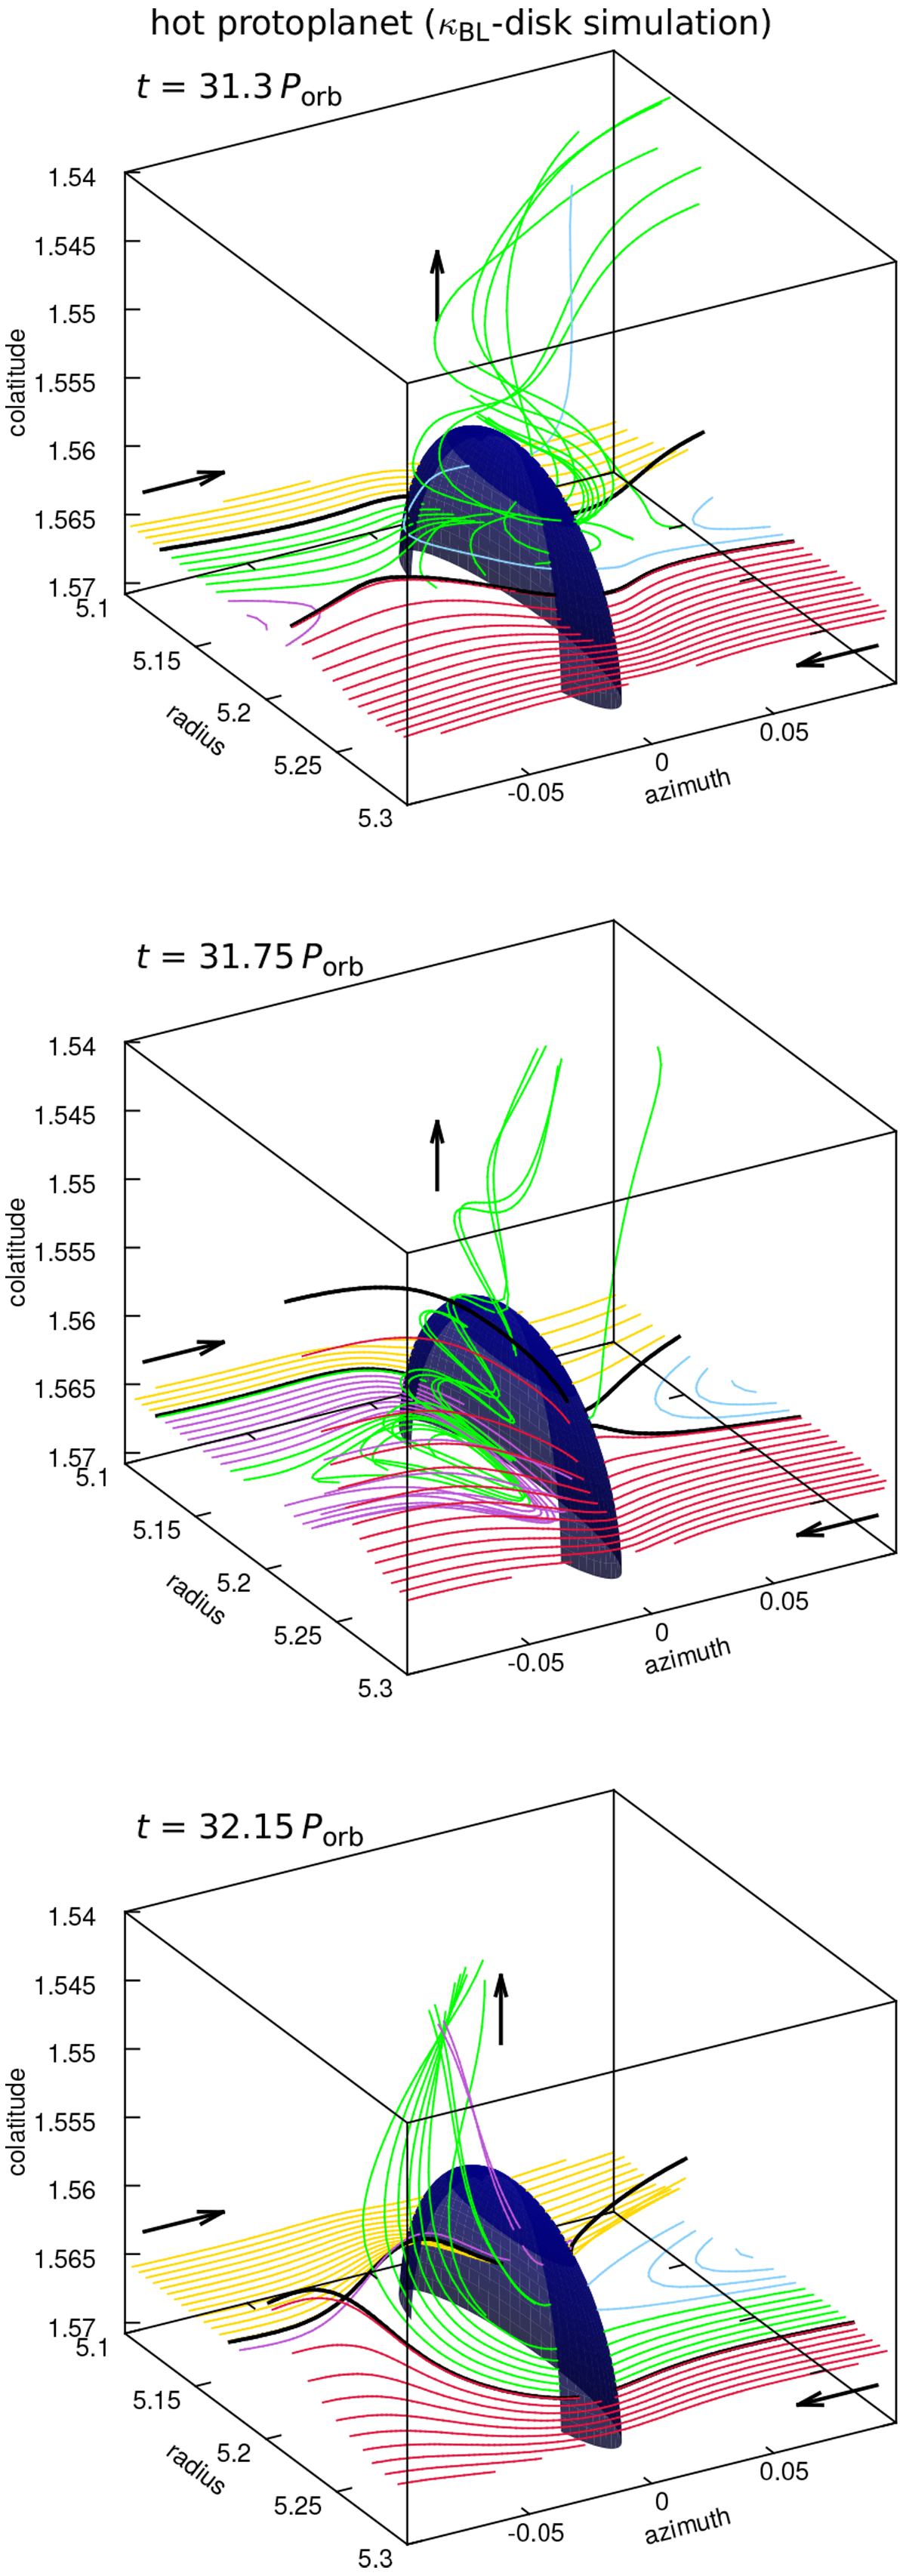
Three-dimensional streamlines in the κBL-disk simulation. Each snapshot is labelled by the simulation time. The panels correspond to the minimum (top) and maximum (bottom) torque and to the state in between (middle).
Current usage metrics show cumulative count of Article Views (full-text article views including HTML views, PDF and ePub downloads, according to the available data) and Abstracts Views on Vision4Press platform.
Data correspond to usage on the plateform after 2015. The current usage metrics is available 48-96 hours after online publication and is updated daily on week days.
Initial download of the metrics may take a while.