Fig. 7
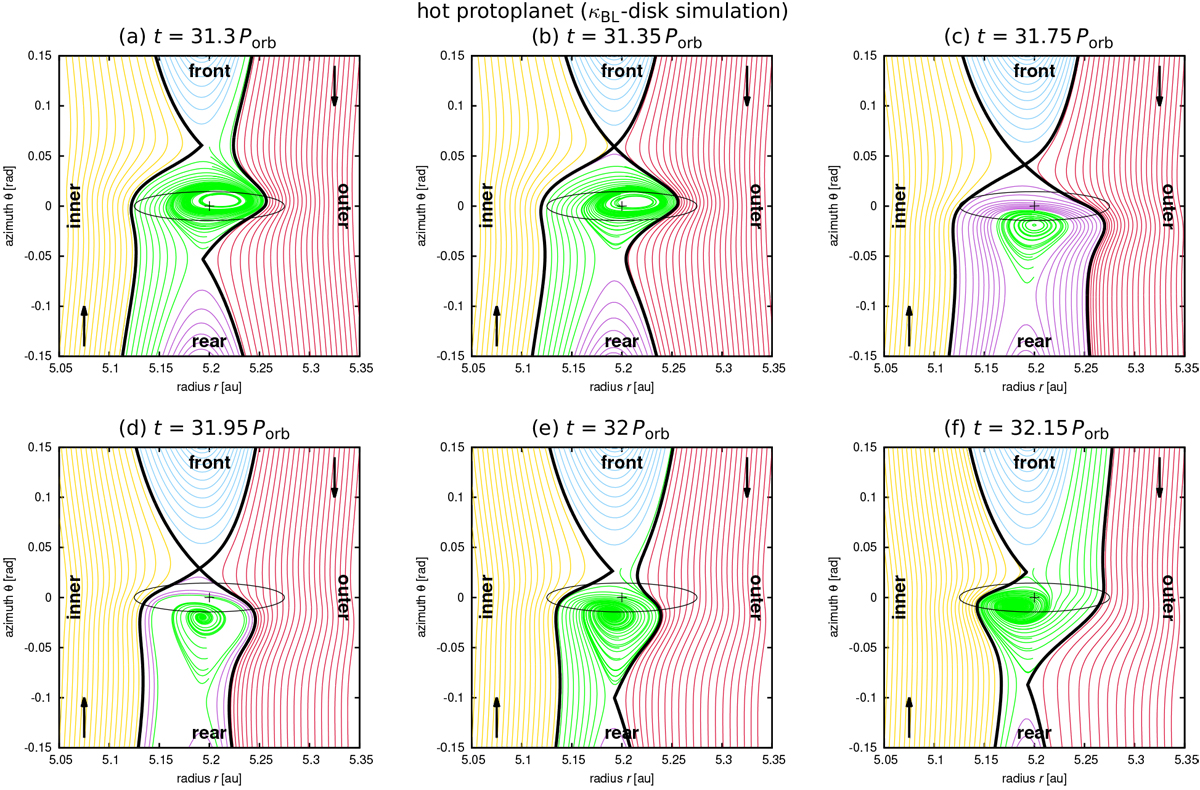
Midplane streamline topology in the κBL-disk simulation. The panels are labelled by the simulation time. The individual types of streamlines are the same as in Fig. 5. The sequence (a–f) represents the transition between the states corresponding to the minimum and maximum of the torque, respectively (see Fig. 2 to relate the panels to the torque evolution).
Current usage metrics show cumulative count of Article Views (full-text article views including HTML views, PDF and ePub downloads, according to the available data) and Abstracts Views on Vision4Press platform.
Data correspond to usage on the plateform after 2015. The current usage metrics is available 48-96 hours after online publication and is updated daily on week days.
Initial download of the metrics may take a while.