Fig. 6
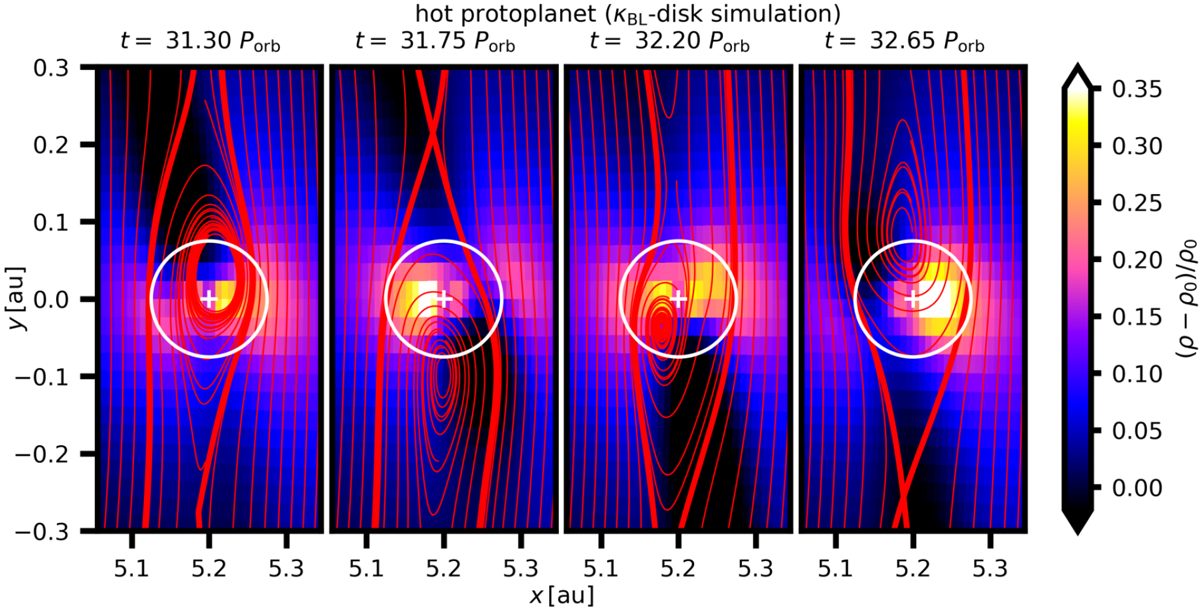
Evolution of the perturbed midplane gas density in the κBL-disk simulation. The corresponding simulation time t is given by labels. Individual snapshots represent the state of gas when the total torque acting on the protoplanet is minimal (left), maximal (third), and oscillating in between (second and right). The streamlines are overplotted for reference. The figure is also available as an online movie, showing the temporal evolution from t = 30–33 Porb.
Current usage metrics show cumulative count of Article Views (full-text article views including HTML views, PDF and ePub downloads, according to the available data) and Abstracts Views on Vision4Press platform.
Data correspond to usage on the plateform after 2015. The current usage metrics is available 48-96 hours after online publication and is updated daily on week days.
Initial download of the metrics may take a while.