Fig. 5
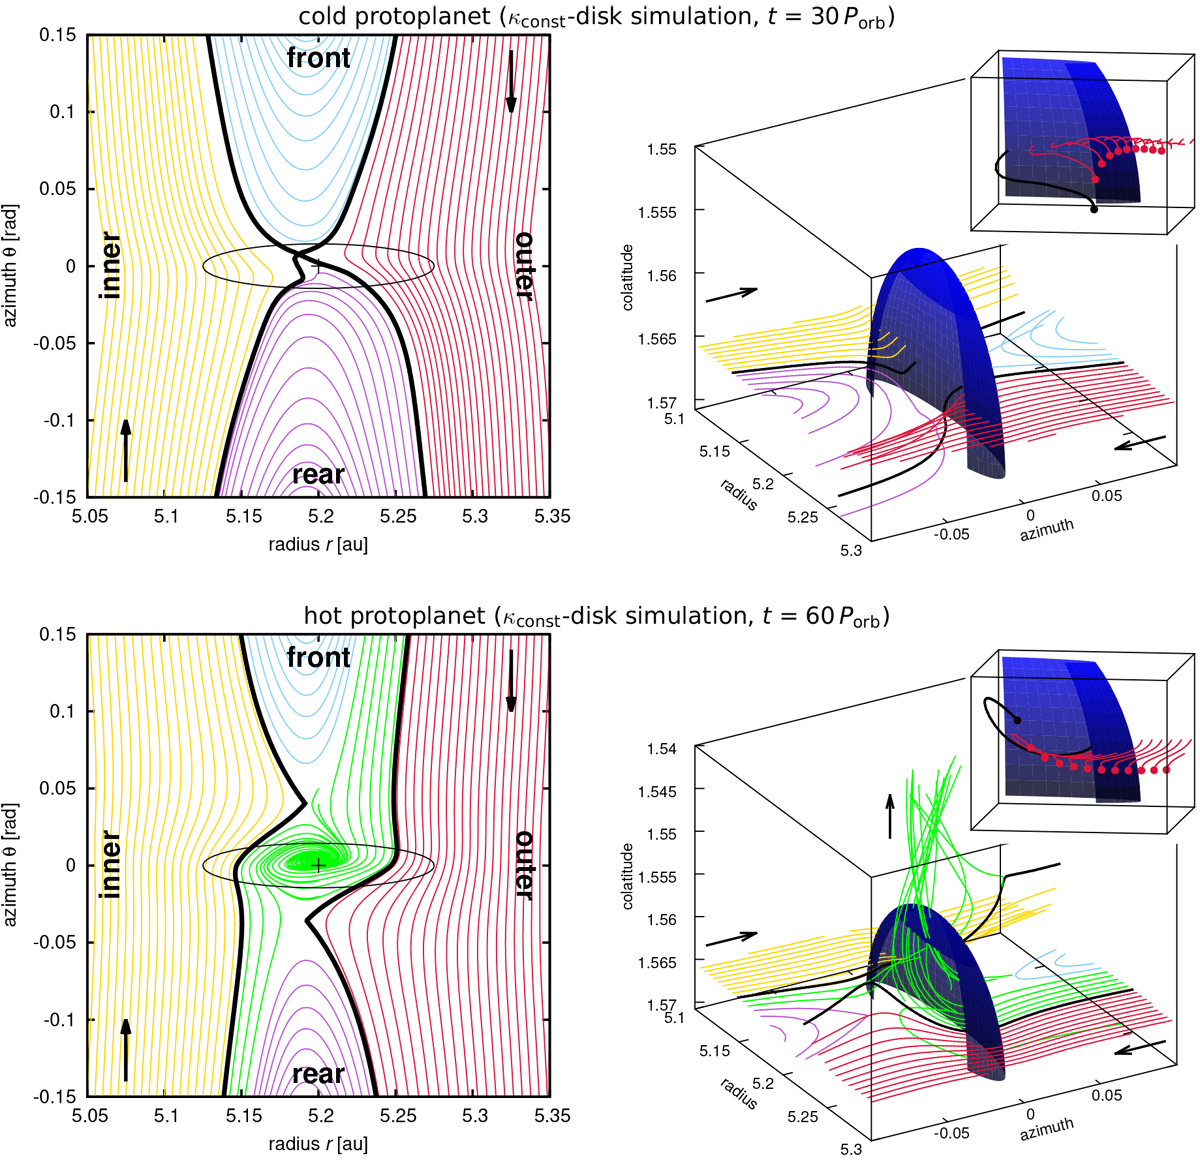
Detailed streamline topology in the κconst-disk simulation. Top row: cold protoplanet at t = 30 Porb. Bottom row:hot protoplanet at t = 60 Porb. Rectangular projection in the spherical coordinates is used to display the disk midplane near the protoplanet (left) and the actual 3D flow (right). The colour of the curves distinguishes individual sets of streamlines: inner circulating (yellow), outer circulating (red), front horseshoe (light blue), rear horseshoe (purple) and other (green). The thick black lines highlight the critical circulating streamlines closest to the protoplanet. The black cross and the ellipse mark the location and Hill sphere of the protoplanet; the black arrows indicate the flow direction with respect to the protoplanet. In 3D figures (right), the dark blue hemisphere corresponds to the Hill sphere above the midplane. Additionally, the insets in the corners of the 3D figures provide a close-up of the upstream outer circulating streamlines viewed from a slightly different angle. The endpoints indicate where the flow exits the depicted part of the space and highlight if the initially coplanar streamlines descend towards the protoplanet (top) or rather rise vertically (bottom). We emphasise that the streamlines in the 3D figures are generated above the midplane and do not directly correspond to those in the 2D figures.
Current usage metrics show cumulative count of Article Views (full-text article views including HTML views, PDF and ePub downloads, according to the available data) and Abstracts Views on Vision4Press platform.
Data correspond to usage on the plateform after 2015. The current usage metrics is available 48-96 hours after online publication and is updated daily on week days.
Initial download of the metrics may take a while.