Fig. 3
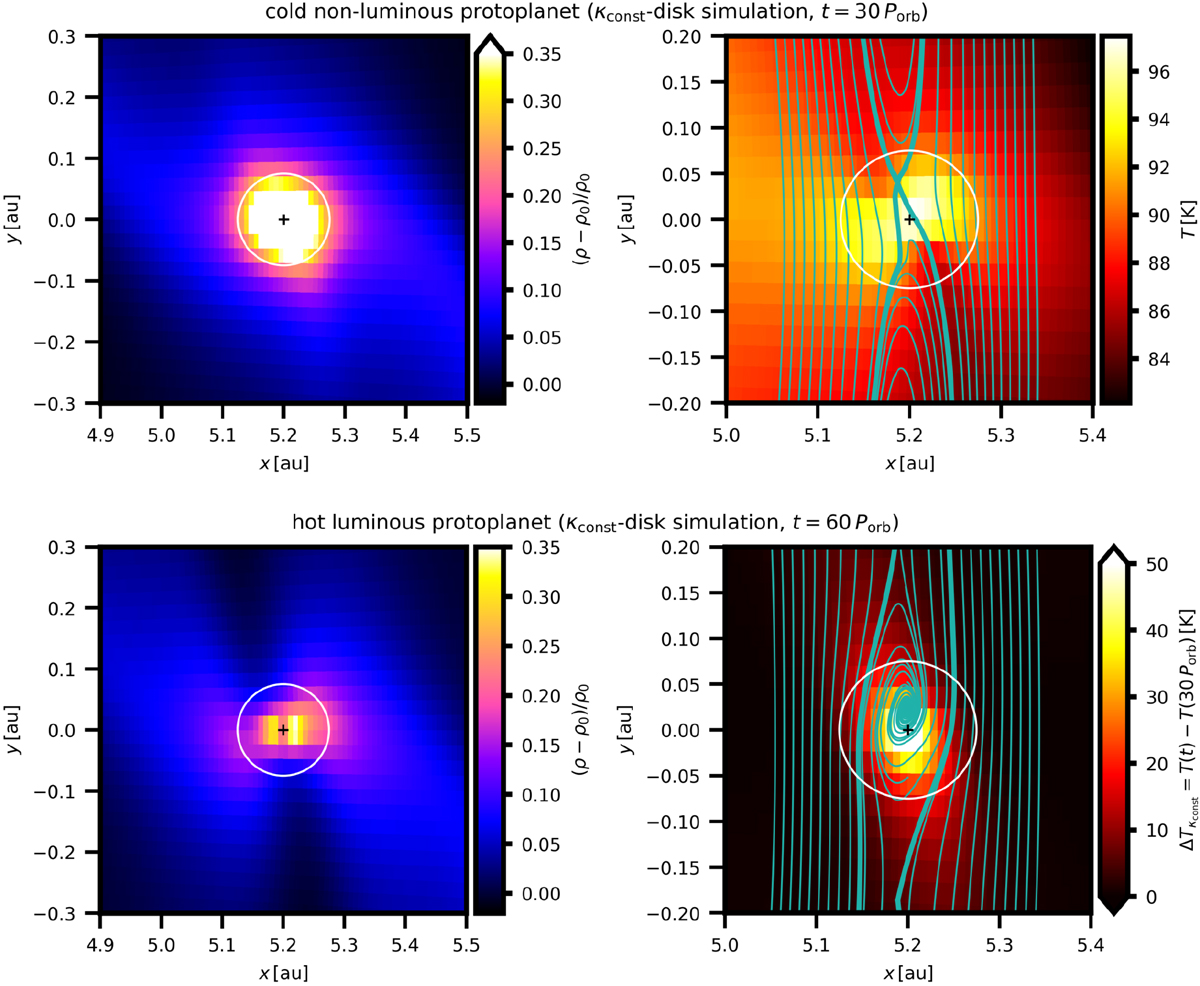
Hydrodynamic quantities in the midplane of the κconst-disk close to the protoplanet. Top row: cold protoplanet right before the accretion heating is initiated (at t = 30 Porb). Bottom row: steady state of gas around the hot protoplanet (at t = 60 Porb). The figure isconstructed as a Cartesian projection of the spherical grid. The density maps (left) display the perturbation (ρ − ρ0)∕ρ0 relative to the equilibrium disk (t = 0 Porb), the temperature map for the cold protoplanet (top right) shows the absolute values, and the temperature map for the hot protoplanet (bottom right) shows the excess with respect to the cold protoplanet (by subtracting T(t = 30 Porb) from T(t = 60 Porb)). The position of the protoplanet is marked with the cross, the extent of its Hill sphere is bordered by the circle. The green curves (right) show the topology of streamlines in the frame corotating with the protoplanet. In the inertial frame, the protoplanet would orbit counterclockwise. The streamlines outwards from its orbit thus depict the flow directed from y > 0 to y < 0; the inward streamlines are oriented in the opposite direction. A detailed view of the streamlines is provided in Fig. 5 where we also sort them according to their type.
Current usage metrics show cumulative count of Article Views (full-text article views including HTML views, PDF and ePub downloads, according to the available data) and Abstracts Views on Vision4Press platform.
Data correspond to usage on the plateform after 2015. The current usage metrics is available 48-96 hours after online publication and is updated daily on week days.
Initial download of the metrics may take a while.