Fig. 13
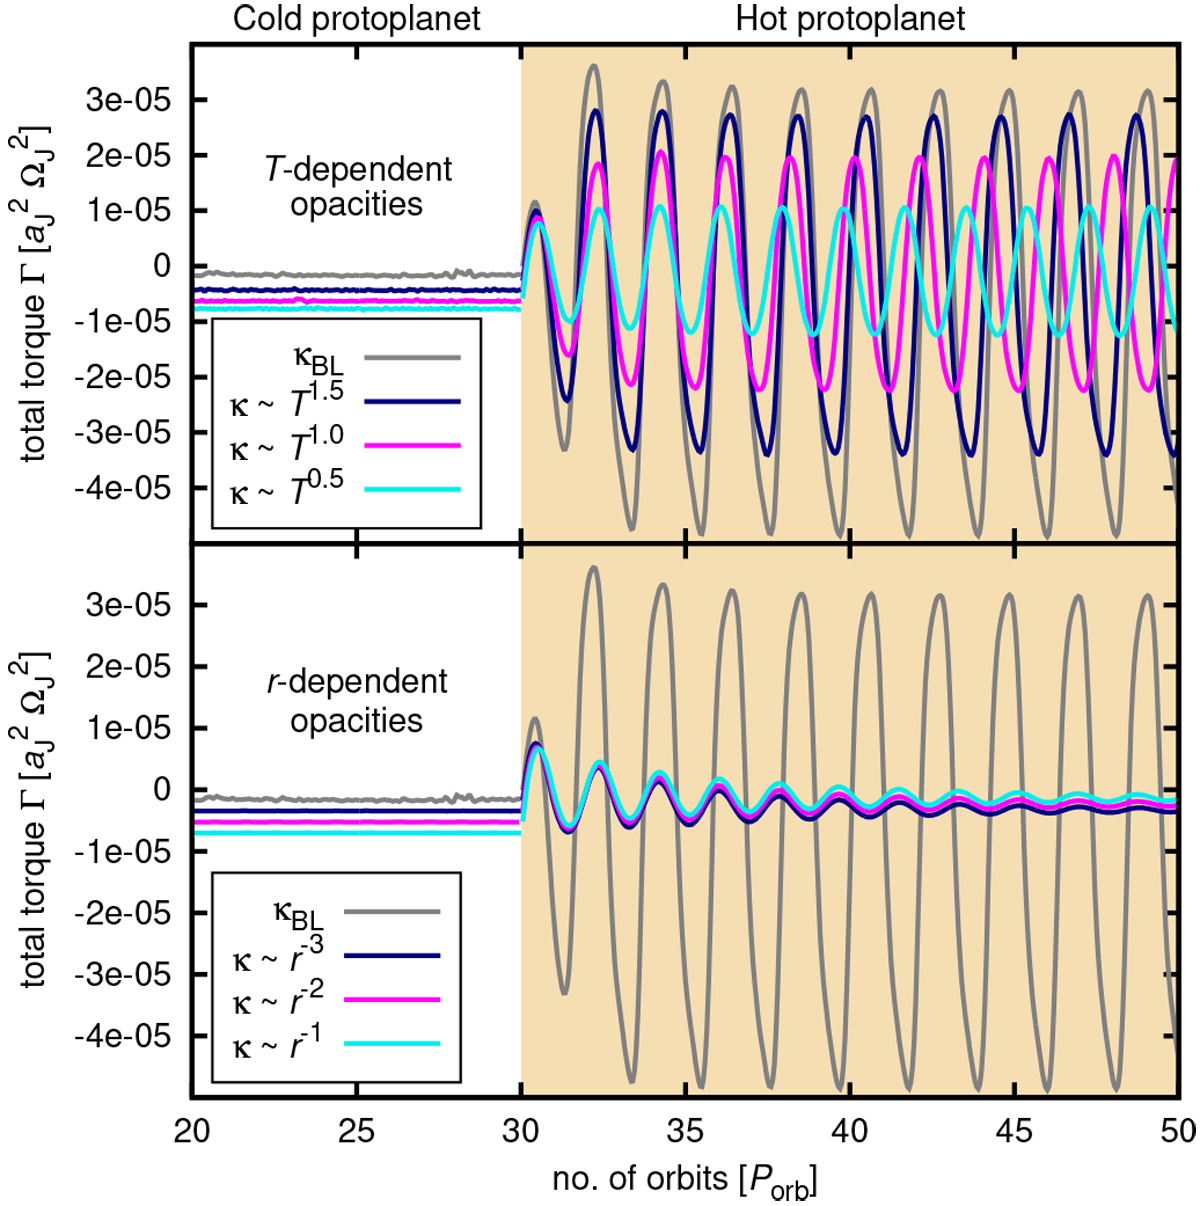
Torque evolution in disks described in Fig. 12. Top panel: disks with T-dependent opacities. Bottom panel: disks with r-dependent opacities. The individual cases are distinguished by colour and labelled in the legend. The evolution from the κBL -disk simulation (solid grey curve) is given for reference. In the top panel, the torque amplitude diminishes with the power-law index of theopacity law, yet the oscillations appear in all studied cases. In the bottom panel, we find that oscillations are rapidly damped.
Current usage metrics show cumulative count of Article Views (full-text article views including HTML views, PDF and ePub downloads, according to the available data) and Abstracts Views on Vision4Press platform.
Data correspond to usage on the plateform after 2015. The current usage metrics is available 48-96 hours after online publication and is updated daily on week days.
Initial download of the metrics may take a while.