Fig. 12
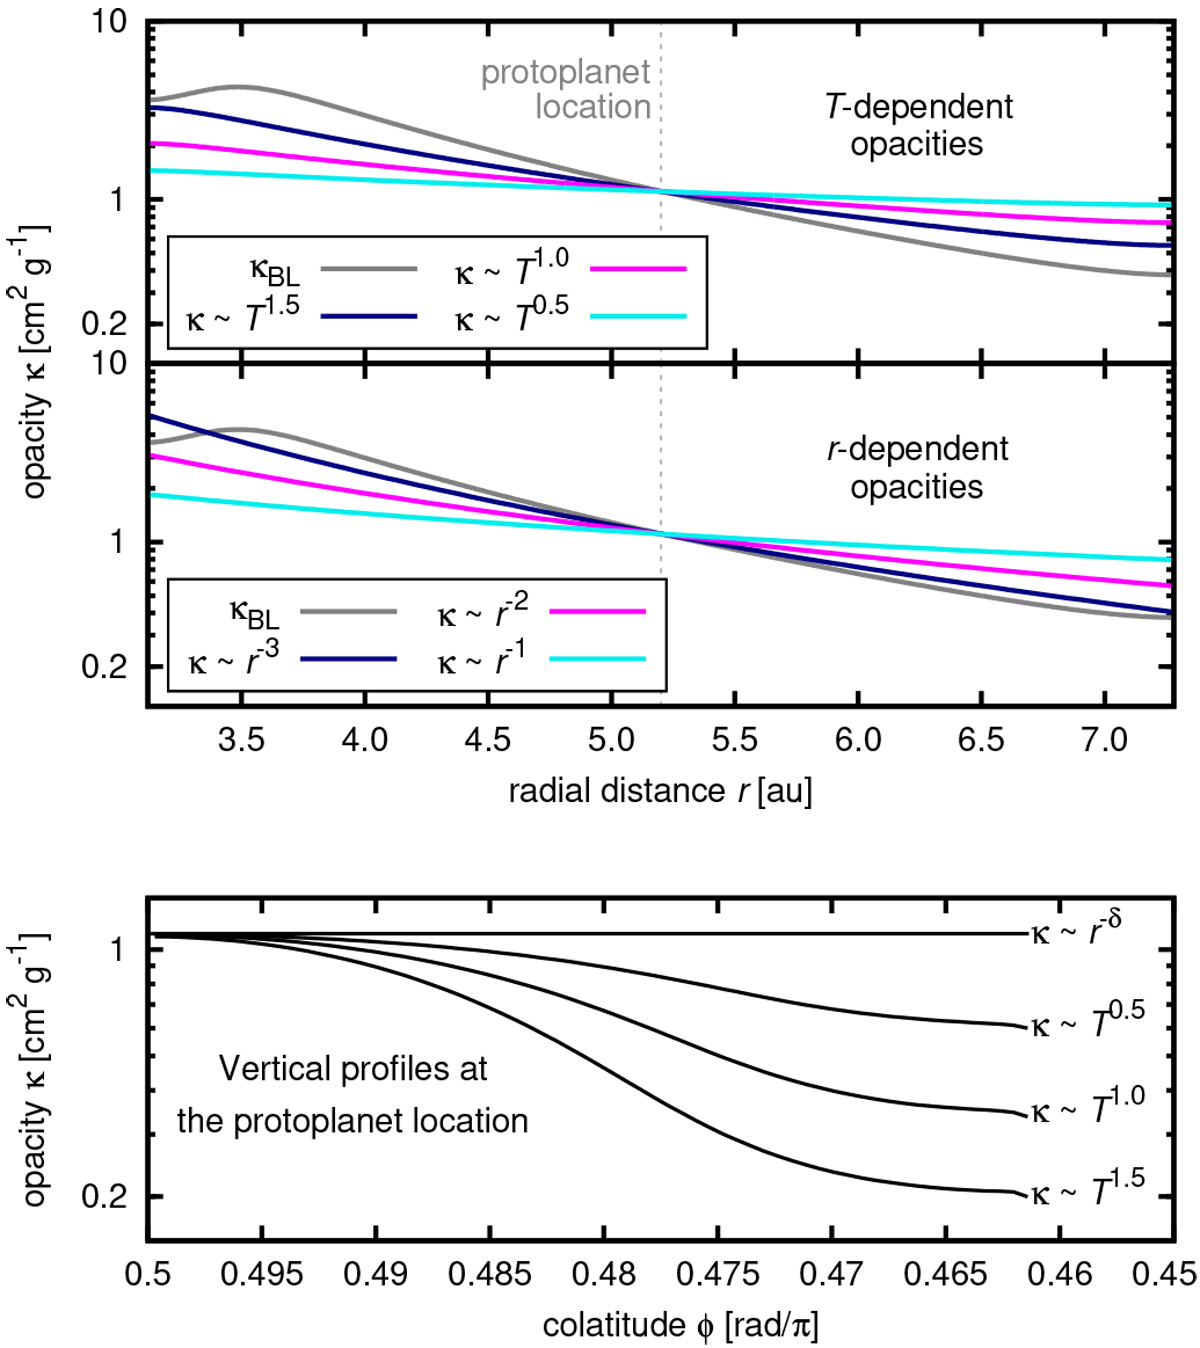
Radial (top two panels) and vertical (bottom) opacity profiles in equilibrium disks which we use to study the torque dependence on the opacity gradients. In the top panels, the individualcases are distinguished by colour and labelled in the legend. The profile of the κBL -disk (solid grey curve) is plotted for comparison. The bottom panel corresponds to the protoplanet location and demonstrates that only thedisks with T-dependent opacities develop a vertical opacity gradient (which is not allowed for r-dependent opacities by construction).
Current usage metrics show cumulative count of Article Views (full-text article views including HTML views, PDF and ePub downloads, according to the available data) and Abstracts Views on Vision4Press platform.
Data correspond to usage on the plateform after 2015. The current usage metrics is available 48-96 hours after online publication and is updated daily on week days.
Initial download of the metrics may take a while.