Free Access
Fig. 10
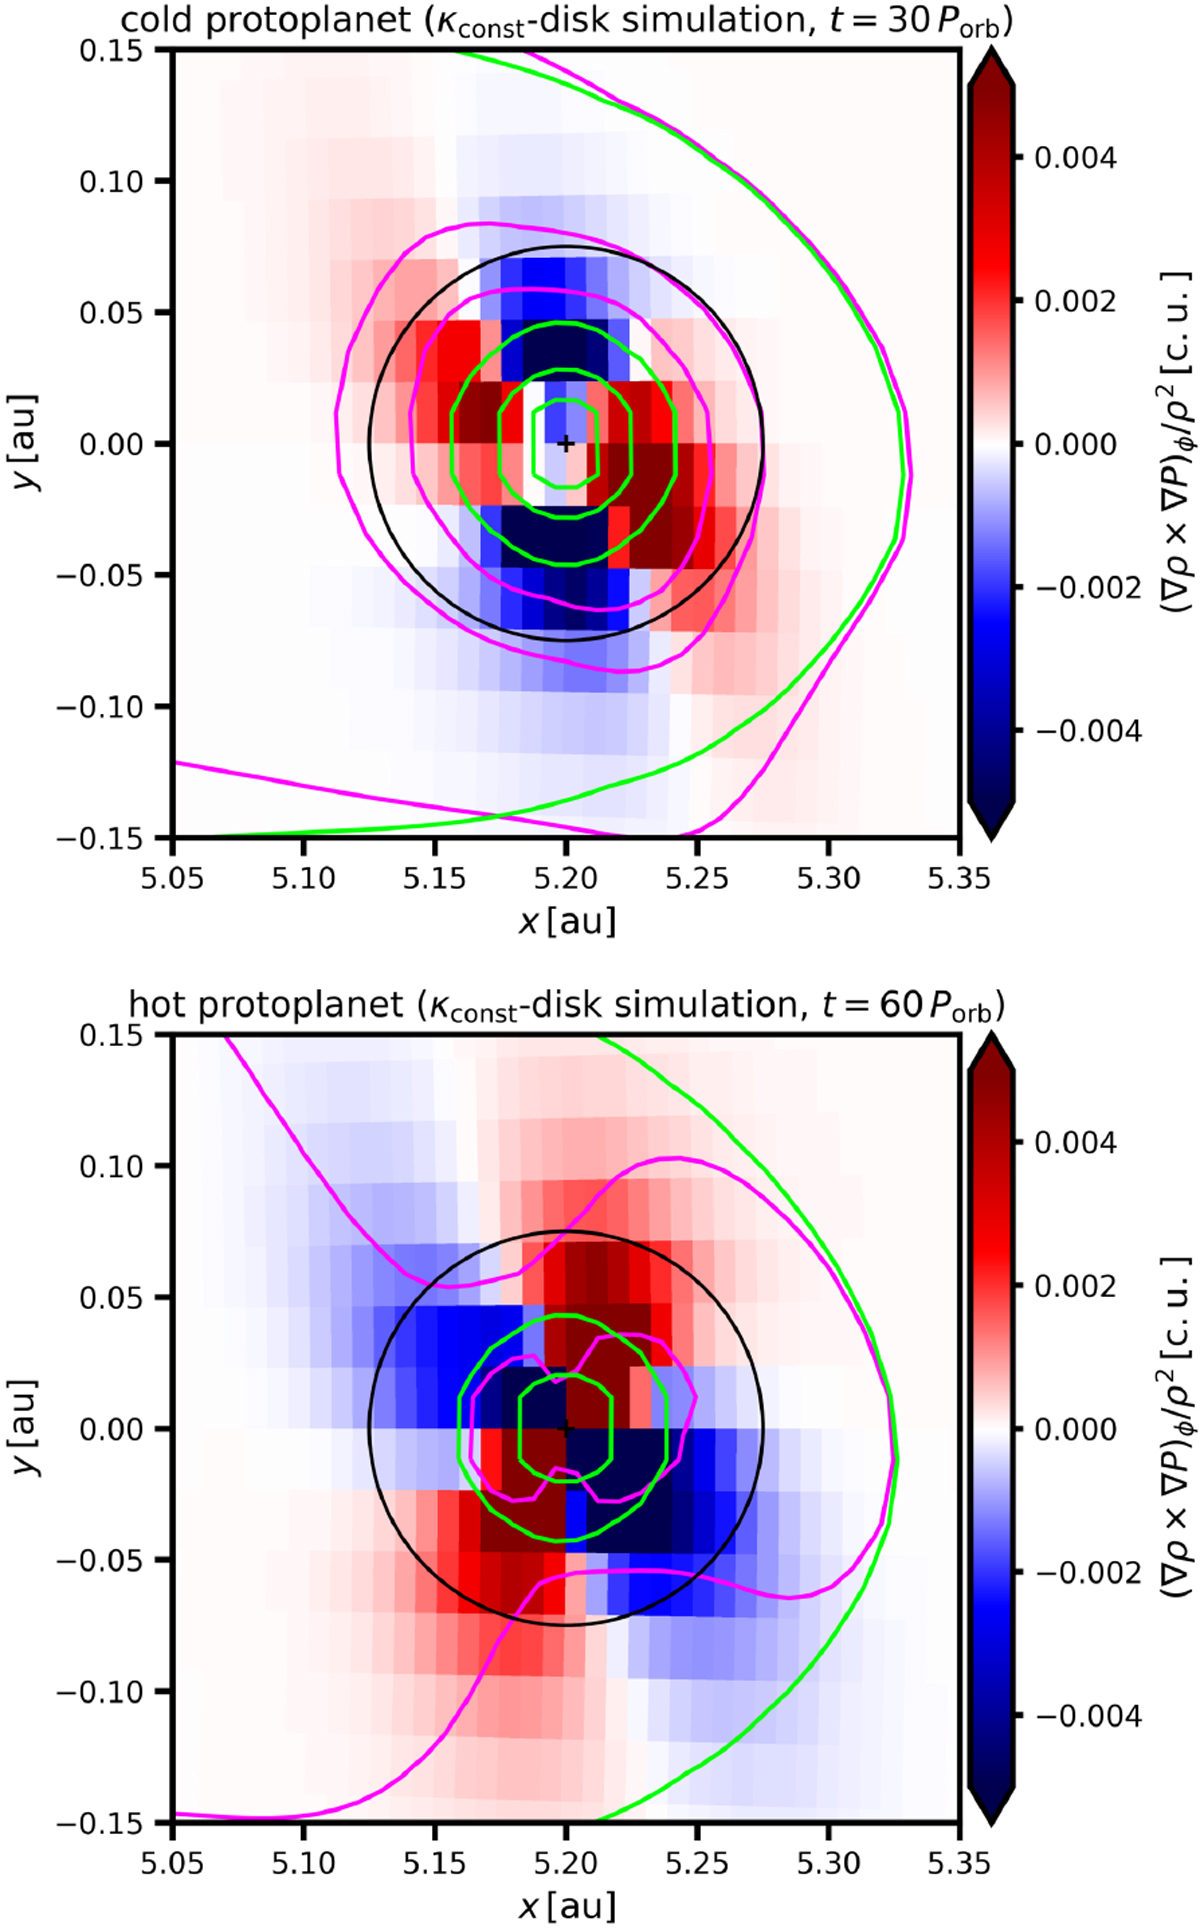
Maps of the ϕ-component of the baroclinic term in the κconst-disk simulation. The purple isocontours depict several levels of the constant volume density and the green isocontours correspond to the isobars. The levels of the contours are kept fixed between the panels.
Current usage metrics show cumulative count of Article Views (full-text article views including HTML views, PDF and ePub downloads, according to the available data) and Abstracts Views on Vision4Press platform.
Data correspond to usage on the plateform after 2015. The current usage metrics is available 48-96 hours after online publication and is updated daily on week days.
Initial download of the metrics may take a while.