Fig. 4.
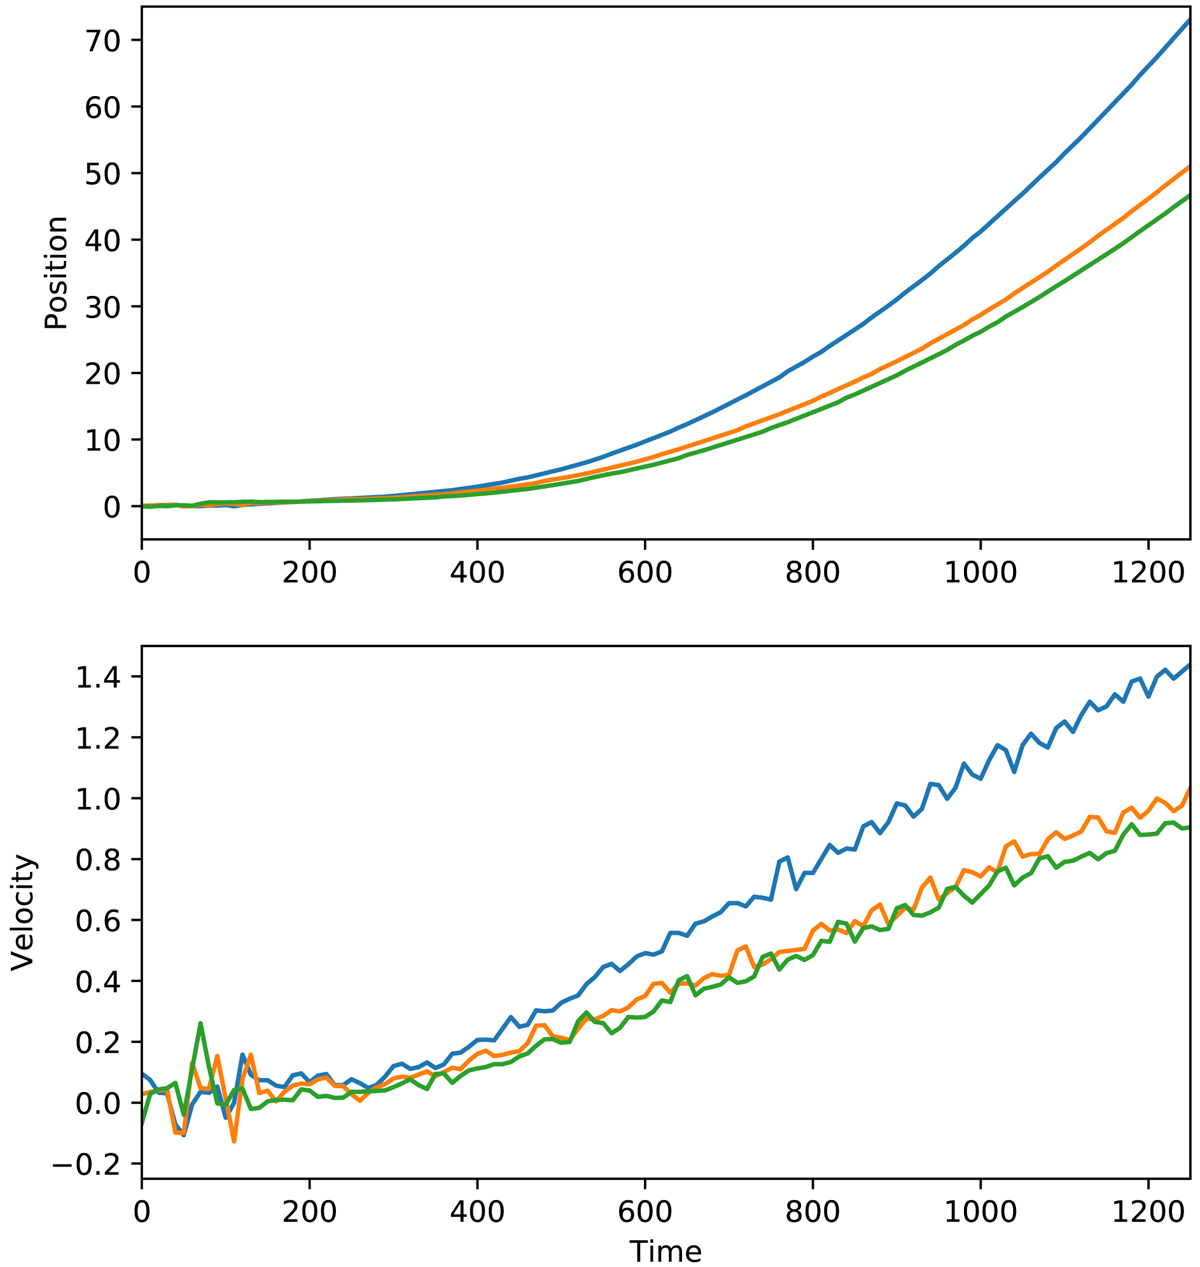
Upper panel: evolution of the galactic core center-of-mass position as a function of time during the simulation run. The blue, orange, and green curves represent the position in x, y, and z, respectively. Lower panel: as above but in this case referring to the velocity vector components. After an initial period of time at rest while the halo is building up, the entire system starts accelerating (at approximately t = 300) and continues to gain speed with a constant acceleration. The sign of the x and y components has been reversed for better visualization in the figure.
Current usage metrics show cumulative count of Article Views (full-text article views including HTML views, PDF and ePub downloads, according to the available data) and Abstracts Views on Vision4Press platform.
Data correspond to usage on the plateform after 2015. The current usage metrics is available 48-96 hours after online publication and is updated daily on week days.
Initial download of the metrics may take a while.