Fig. 5
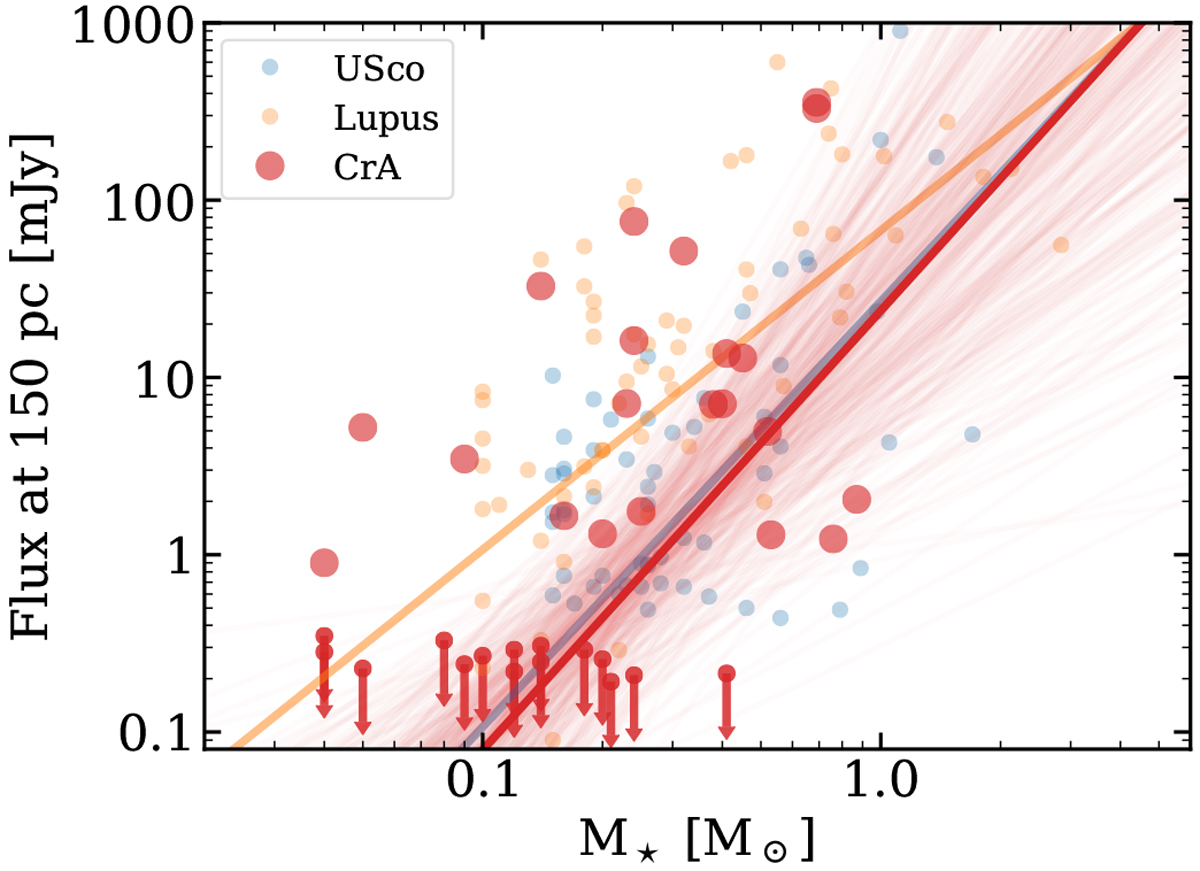
Correlation between dust disk flux scaled at 330 GHz (assuming α = 2.25, as in Ansdell et al. 2018) and at a distance of 150 pc with stellar mass for the objects in CrA. The slopes of Lupus and Upper Sco are also plotted for comparison. We show the results of the Bayesian fitting procedure by Kelly (2007). The solid line represents the best-fit model, while the light lines show a subsample of models from the chains, giving an idea of the uncertainties.
Current usage metrics show cumulative count of Article Views (full-text article views including HTML views, PDF and ePub downloads, according to the available data) and Abstracts Views on Vision4Press platform.
Data correspond to usage on the plateform after 2015. The current usage metrics is available 48-96 hours after online publication and is updated daily on week days.
Initial download of the metrics may take a while.