| Issue |
A&A
Volume 626, June 2019
|
|
|---|---|---|
| Article Number | A25 | |
| Number of page(s) | 9 | |
| Section | Planets and planetary systems | |
| DOI | https://doi.org/10.1051/0004-6361/201834867 | |
| Published online | 07 June 2019 | |
Characterisation of the Perseid meteoroid stream through SPOSH observations between 2010–2016
1
Department of Planetary Geodesy, Technische Universität Berlin,
Strasse des 17. Juni 135,
Berlin,
Germany
e-mail: This email address is being protected from spambots. You need JavaScript enabled to view it.
2
Armagh Observatory and Planetarium,
College Hill,
Armagh
BT61 9DG,
UK
3
German Aerospace Center, Institute of Planetary Research,
Rutherfordstr. 2,
12489
Berlin,
Germany
Received:
14
December
2018
Accepted:
30
March
2019
Abstract
We have characterised the Perseid meteoroid stream from data acquired in a series of observing campaigns between 2010 and 2016. The data presented in this work were obtained by the Smart Panoramic Optical Sensor Head (SPOSH), an all-sky camera system designed to image faint transient noctilucent phenomena on dark planetary hemispheres. For the data reduction, a sophisticated software package was developed that utilises the high geometric and photometric quality of images obtained by the camera system. We identify 934 meteors as Perseids, observed over a long period between late July (~124°) and mid-to-late August (~147°). The maximum meteor activity contributing to the annual shower was found at λ⊙ = 140°.08 ± 0°.07. The radiant of the shower was estimated at RA = 47°.2 and Dec = 57°.5 with a median error of 0°.6 and 0°.2, respectively. The mean population index of the shower between solar longitudes of 120°.68 and 145°.19 was r = 2.36 ± 0.05, showing strong temporal variation. A predicted outburst in shower activity for the night of August 11–12, 2016 was confirmed, with a peak observed 12.75 hr before the annual maximum at 23:30 ± 15′ UT. We measure a peak flux of 6.1 × 10⁻⁴ km−2 hr−1 for meteoroids of mass 1.6 × 10⁻² g or more, appearing in the time period between 23:00 and 00:00 UT. We estimate the measured flux of the outburst meteoroids to be approximately twice as high as the annual meteoroid flux of the same mass. The population index of r = 2.19 ± 0.08, computed from the outburst Perseids in 2016, is higher than the value of r = 1.92 ± 0.06 derived from meteors observed in 2015 belonging to the annual Perseid shower which was active near the time of the outburst. A dust trail with an unusually high population index of r = 3.58 ± 0.24 was encountered in 2013 between solar longitudes 136°.261 and 137°.442. The relatively high r-value implies an encounter with a dust trail rich in low-mass particles.
Key words: meteorites, meteors, meteoroids / methods: observational / techniques: image processing / methods: data analysis / comets: individual: 109P
© ESO 2019
1 Introduction
Every year around August 12, the Earth passes through the core of a dust cloud originating from comet 109P/Swift-Tuttle, a Halley-type comet discovered in 1862. As the Earth passes through these dust particles, around 100 meteors per hour can be observed by the naked eye. The meteors appear to radiate from a single point in the sky located near the constellation of Perseus at the time of maximum activity. The Perseids are one of the most prominent meteor showers occurring during the summer, and are primarily visible in the northern hemisphere.
The Perseid meteor shower has been persistently active, with a similar annual rate and only minor yearly variations. This indicates that the Perseids are a comparably old meteoroid stream (Harris & Hughes 1995; Brown & Rendtel 1996). However, young stream portions, characterised by trails of fresh dust of high concentration and greatly increased shower activity (“outbursts”), also exist. Every time Earth crosses such a dust trail, an unusually high number of meteors, can be observed. This increased activity usually lasts less than an hour. This was the case in the years 1988–1994, when greatly enhanced meteor activity was observed in the years before and after the return of the comet in 1992 (Brown & Rendtel 1996; Jenniskens et al. 1998). The reappearance of the comet improved the existing orbit and photometric models and allowed the successful prediction of future outbursts, concerning the time of occurrence and level of meteor activity, in the following years (Lyytinen & van Flandern 2004; Jenniskens 2006; Maslov 2016).
Although the Perseids have been extensively observed and recorded visually providing information on the temporal and spatial distribution of the meteoroid stream, information regarding their radiant position and speed for different dust trails cannot be inferred with high accuracy. Several video camera networks operate and obtain a high number of shower meteors each year (SonotaCo 2009; Jenniskens et al. 2016; Wiśniewski et al. 2017, and more). However, a dedicated analysis of the Perseid meteoroid stream from data acquired in consecutive years is missing. Furthermore, camera networks consist of various types of sensors, applying different software for the detection of meteors and the reduction of the data. This may result in findings that are biased by a number of systematic errors, concerning the instrument and/or the reduction method applied each time.
In this study we have used a large homogeneous meteor data set acquired in recent years for the characterisation of the Perseid meteoroid stream. Our study focuses both on the old annual stream and on young dust trails. In order to identify sub-structures within the background meteoroid stream, a dedicated software was developed and its performance was validated using synthetic data (Margonis et al. 2018). From the estimated statistical uncertainties between the known and the calculated radiant positions of the synthetic meteors, we demonstrate the efficiency of the software to distinguish between radiants of the same stream.
This paper is organised as follows: the next section describes the camera system and the observations. Section 3 gives a brief overview of the reduction software (Sect. 3.1) and presents the methodology (Sects. 3.2 and 3.3) used to produce the results given in Sect. 4. In Sect. 5 we restate the most important findings of this work and compare them with results from previous studies. Our conclusions are given in Sect. 6.
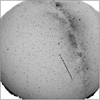 |
Fig. 1 Typical SPOSH image showing a meteor captured from Parnon observing site on August 12, 2010 at 19:06:40. The meteor trail is intercepted by the rotating shutter generating meteor segments of 0.06 s. |
2 Equipment and observations
2.1 The SPOSH camera
The SPOSH camera was designed to image faint transient noctilucent phenomena, such as aurorae, electric discharges, meteors, or impact flashes on dark planetary hemispheres from an orbiting platform (Oberst et al. 2011). Four breadboard units have been developed following stringent technical specifications. The camera is equipped with a highly sensitive back-illuminated 1024 × 1024 CCD chip and has a custom-made optical system of high light-gathering power with a wide field-of-view (FoV) of 120 × 120°. A sophisticated digital processing unit, designed for real-time image processing and communication with a spacecraft, operates the camera and generates high-dynamic 14-bit images (Fig. 1). Due to the all-sky coverage of the camera and the excellent radiometric and geometric properties, it can be used to obtain a large number of meteors with reliable event statistics.
2.2 Observations
A series of observing campaigns were carried out between 2010 and 2016 from southern Greece. Two SPOSH camera systems were deployed at two sites, separated by a 51.5 km-long baseline, on the mountains of Mainalon and Parnon located at 1600 m and 1400 m above sea level, respectively. The sites are situated on remote areas exposed to low light pollution, thus ensuring excellent observing conditions. The exact location of the site on Mainalon was at 37° 15′ 34.1″N, 22° 35′ 11.3″E and on Parnon at 37° 38′ 50.1″N, 22° 16′ 7″E. The camera fields-of-view from the two stations overlapped, thanks to the near all-sky coverage of the cameras. To determine the meteor speed, a shutter consisting of two blades was mounted in front of the camera lens, rotating with a known frequency of 250 RPM.
The observations spanned a period of nearly 30 days at solar longitudes λ⊙ = 119°–147° covering roughly the complete active period of the shower (Fig. 2). The cameras were typically operated between 19:30 and 03:00 UT generating ~15,000 images per observing night. The data were compressed and stored as fits files containing 20-min intervals of image data. Despite the generally excellent weather conditions prevailing during the observations, a small fraction of observing time at a few nights was lost due to cloud cover (<10%). The lens had to occasionally be cleaned of accumulated condensation on humid nights.
3 Methods
3.1 Dataprocessing
The data were reduced using SPOSH-Red, a software package developed for the SPOSH camera system (Margonis et al. 2018). The software consists of different modules, each carrying out distinct tasks in the characterisation of a meteor event.
First, meteors are identified in the image data by applying the Hough transform method to detect linear features. Stationary features are removed by subtracting the former and latter images from the image of interest. Non-meteor features like aircraft or satellites are filtered out during the meteor detection process by using several criteria based on morphological characteristics of each event.
The camera calibration is performed using >1000 stars visible in the image, for which the precise positions and magnitudes are known. For the calibration, stars of up to +8 magnitude were used. The inner and outer orientation of the camera is determined along with the focal length and the image distortion parameters using least squares. The pointing accuracy of the camera is typically 1/4 of a pixel or <1.68 arcmins and consistent over the entire field-of-view (Elgner et al. 2006).
The reconstruction of the meteor trajectory is based on the plane-intersection method described in Koschny & Diaz del Rio (2002). The meteor speed is determined by first correcting the image obtained by the station equipped with the shutter for geometric effects and then comparing this image to a pre-computed database of simulated images of meteors travelling at different speeds. Determination of the speed is not currently possible for meteors with a low angular velocity. In these cases, the shutter-breaks of the meteor trail overlap, making it difficult to identify each shutter break and thus, estimate its speed. Furthermore, the estimation of the speed fails for faint meteors with durations <0.2 s resulting into an inadequate number of shutter-breaks.
The photometric reduction of the data was performed using a time-domain deconvolution technique which allows photometric measurements at high time-resolution (Christou et al. 2015). The magnitude of a meteor is determined by comparing its brightness with those of field stars and correcting it for the atmosphere extinction.
3.2 Meteor shower identification
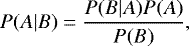
The association of the meteors to different showers is performed using a naive Bayes classifier. We chose this approach over the well established D-parameter method (Southworth & Hawkins 1963) mainly for its flexibility, for example, other non-dynamical measured quantities (light curve properties, spectra etc.) can easily be incorporated into the classification process which we envisage in future studies. Further, it is computationally fast since several families can be identified in a single straight-forward step. Nevertheless, we expect the two methods to produce similar results when applied to the same dataset. In this work, our model uses the radiant position (RA, Dec) and the observed speed (V∞), which constrain the orbit of a meteoroid, and the time of occurrence expressed as the solar longitude λ⊙ of each meteor as input parameters. Assuming that these parameters are distributed normally for each meteor shower present in our dataset, we defined the characteristics of the normal distribution for every parameter of every shower from well-defined values describing each meteor shower (Jenniskens 2006). According to the statistical properties of each shower we compute the probability of each meteor event to be assigned to each of these showers following the Bayes rule:
 (1)
(1)
where P(B|A) is the likelihood of an event B (meteor) to be assigned to class A (shower), P(A) and P(B) are the class prior probabilitiesof class A and event B respectively and P(A|B) is the conditional probability of event B being in class A. Each meteor is assigned to a meteor shower with the highest probability among all showers. We note that the identification of the shower meteors in this study depends on the initial values of the location and dispersion of the radiant assigned for each relevant shower. In the following sections, meteors and shower meteors will refer to those meteors already identified by this method as Perseids.
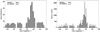 |
Fig. 2 Left panel: histogram of the number of observing hours for each station as a function of the solar longitude accumulated from seven years of observations (2010–2016). Right panel: number of meteors detected from each station for the same time window. The use of the rotating shutter in one of the stations reduces the effective exposure time and results in a lower number of observed meteors. The binsize for both histograms is 1°. |
3.3 Flux measurements
A meteoroid stream can be characterised by calculating its flux Q and spatial number density ρ as a function of time. The flux determines the number of meteoroids of more than a given mass passing through a unit area in unit time, while spatial density specifies the number of meteoroids of more than a given mass in a unit volume and in unit time.
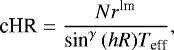
In order to determine flux estimates for the acquired data, the number of meteors detected by the camera within a time interval needs to be calculated. This was done by computing the corrected hourly rates (cHR) of the shower meteors. Similar to the zenithal hourly rate (ZHR), which is a normalised meteor rate applied to visual observations, cHR is defined as the number of shower meteors brighter or equal to the meteor limiting-magnitude lm, seen within an hour corrected for the altitude of the radiant at a given time. The cHR is computed as
 (2)
(2)
where N is the number of shower meteors observed in a time interval Teff (in hours), r is the population index of the stream, lm the limiting-magnitude of the imaging system and the exponent γ is a velocity-dependent coefficient used to correct the rates at particularly low radiant altitudes. In this work we have considered time intervals with radiants >20° for which the corrections applied are less than 50% when γ <0.5. Furthermore, the limiting-magnitude of all-sky cameras increases during the morning hours due to the increasing brightness of the sky. We simplified our computations by assuming a single lm for all observing nights accounting for observations up to 02 UT.
The population index r describes the distribution of meteoroids within a stream. A low index indicates a shower that is rich in bright meteors, whereas high values indicate a stream consisting primarily of faint meteors. The population index is expressed as r = N(m+1)/N(m) where N(m) is the total number of meteors of magnitude m or brighter. The index r can be derived from the cumulative magnitude distribution plot as the slope of the straight line fitted to the linear part of the data distribution (Fig. 4).
To estimate the flux, the collecting area of the double-station network must be determined. We first calculated the raw collecting area by dividing the FoV of the camera into a 5 × 5° two-dimensional grid, following the method described by Blaauw et al. (2016). The squares were projected to a reference height1 defining irregular quadrilaterals due to the effects of perspective distortion present in wide-angle cameras. The overlapping area between the two stations is determined from their known relative position. Rectangles which are outside the FoV of the second camera are neglected. For each of the remaining rectangles, the area is measured by approximating their shapes with those of irregular-quadrilateral rectangles (trapezia).
The second step is to apply a correction for each projected raw area based on the magnitude loss function. The magnitude loss function depends (i) on the distance between the meteor and the camera (Eq. (3)), (ii) the angular velocity of the meteor (Eqs. (4) and (5)) and (iii) the atmospheric extinction (Eq. (6)). The magnitude loss due to the distance is calculated as
 (3)
(3)
with dm being the distance from the meteor to the camera and H the reference height. Meteors with low angular velocities appear brighter, due to their increased dwell time on each pixel of the camera. The angular velocity of the meteor is calculated as
 (4)
(4)
where V∞ is the pre-atmospheric velocity of the meteoroid, ξ is the angular distance from the meteor to the radiant and h the altitude of the meteor above the horizon (Bellot Rubio 1994). The magnitude loss for the effects of the angular velocity is then computed as
 (5)
(5)
where ωo is the angular velocity of the meteor if it would appear on the zenith. The atmospheric extinction is calculated as
 (6)
(6)
where Z is the airmass as a function of altitude (Gural 2002). The overall magnitude loss for each rectangular area is calculated by adding the parameters estimated from Eqs. ((3), (5), and (6)). The correction for each rectangular area is computed as r−Δ(mi) accounting for those meteors being brighter or equal than the meteor limiting-magnitude but are not detectable by the camera system (Fig. 3). On the other hand, faint meteors with magnitudes >lm appearing around the radiant will be visible due to their low angular velocity. The correction is applied to each calculated area and the reduced collecting area is computed as the sum of all corrected areas at a reference height H.
In general, collecting areas should be calculated for each height, since the projection of a rectangle at different heights results in different areas. However, the height distribution of all meteors in our data with magnitudes ≤ +0 fall in a relative narrow range with a mean value of 103 ± 3.4 km. The difference in the reduced collecting areas within the 3σ height rangeof our dataset is only 7%. Therefore, the mean value was used for the calculation of the reduced collecting area as reference height.
The flux of the Perseids Q(m) with magnitudes less or equal than m is calculated as
 (7)
(7)
where Ared is the reduced collecting area. The spatial number density ρ can be then computed as
 (8)
(8)
where V∞ is the observed speed of the meteor. We note that in this work, pre-atmospheric and observed speed refer to the same physical parameter, that is, the speed of a meteor with deceleration effects is neglected.
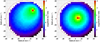 |
Fig. 3 Corrections computed using the magnitude loss function for the field-of-view of the camera. Each square has an angular distance of five degrees. The coloured squares represent the overlapping area of the two stations at a height of 100 km, assuming a circular field-of-view of 60° radius. The colours represent the amount of loss in magnitude. Areas with cold colours represent parts of the field-of-view where meteors will appear fainter, while meteors appearing in hot-coloured squares will appear brighter. Meteors located in the red squares will appear as point-like sources since this area indicates the apparent position of the radiant. Left figure: radiant is located at azimuth = 45°, altitude = 50°. Right figure: at azimuth = 70°, altitude = 80° with respectto the camera viewing direction. |
4 Results
4.1 Meteor activity
From seven years of observations we obtained 3318 double-station meteors. We applied our meteor identification algorithm using the radiant position, speed, and solar longitude of each meteor event and found 934 meteors belonging to the Perseid meteor shower. ThePerseids outnumbered other meteor showers being active during the observations except the time period between λ⊙ = 119°.6–124°.5 where a total of three Perseids were detected (Table 1). From λ⊙ = 125°.2 Perseid rates gradually increased towards the annual peak of the shower.
The meteor limiting-magnitude of the camera was derived from the measured magnitudes of all shower meteors used in a logarithmic cumulative magnitude distribution plot (Fig. 4). We estimated this magnitude of the SPOSH camera to be +0.2 for those meteors which appear in a high enough number of frames to allow a speed determination. This implies that fainter meteors can be detected but it is at present not possible to obtain their speeds. The meteor limiting-magnitude corresponds to a mass of 1.6 × 10⁻² g applying the formula given by Verniani (1973) and assuming a speed of 59 km s−1.
Figure 5 shows the corrected hourly rates cHR between solar longitudes 124°–146° for meteors brighter than our limiting-magnitude of +0.2, calculated at two-hour intervals for each observing year. From the calculations, the meteor activity profile around the peak of the shower appears nearly symmetric and can be described by two lines in log-normal space. The ascending branch of the shower between λ⊙ = 135° and λmax = 139°.74 shows an exponential increase with a slope of B = 0.18 ± 0.06 consistent with the value of B = 0.20 ± 0.01 found by Jenniskens (1994). The descending branch from λmax to λ⊙ = 145°.20 appears to be steeper with B = 0.29 ± 0.03. The asymmetry of the shape of the activity curve could be attributed to the poorly observed post-activity of the shower between λ⊙ = 139°.74 and 145°.20 (Fig. 6). The peak of the shower was estimated to be at λ⊙ = 140°.08 ± 0.07 determined at the centre of a Gaussian curve fitted to the corrected hourly rates calculated for all years, except the ones associated with an outburst which occurred on August 11–12, 2016 (see Sect. 4.5).
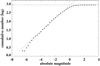 |
Fig. 4 Cumulative number of Perseids as a function of their absolute magnitudes. The population index r = 2.36 is derived from the slope of the line. The intersection of the lines defines the meteor limiting-magnitude of the camera system. |
Observing periods, observing times, and total number of meteors and Perseids for each meteor campaign.
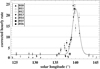 |
Fig. 5 Corrected hourly rates of the Perseids calculated for each observing night at two-hour intervals. Each symbol in this plot represents a different year. |
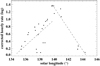 |
Fig. 6 Activity curve shape of the shower around its maximum. The slope of the two straight lines describes the intensity of increasing and decreasing meteor rates at the peak and characterises the stream. |
4.2 Radiant and speed
The apparent position of the radiant changes as an effect of the Earth’s own orbital motion around the Sun. The radiant drift of the shower was found to be 1.32°/λ⊙ in RA and 0.22°/λ⊙ in Dec. These values agree with those published in previous studies. Lindblad & Porubčan (1995) analysed 592 double-station photographic observations and derived a daily motion of 1°.39 in RA and 0°.20 in Dec Jenniskens et al. (1998) derived a drift of 1.36 in RA and 0.28 in Dec by analysing 53 double-station video observations in 1993/1994. The calculated values were used to correct the positions of the radiants of individual meteors for radiant drift. The mean radiant of all 934 meteors identified as Perseids referred to λ⊙ = 140° is centred atRA = 47°.2 and Dec = 57°.5 with a median error of 0°.6 and 0°.2, respectively (Fig. 7). The 1σ dispersion of the radiant is found to be 2°.59 in RA and 1°.37 in Dec. Ourvalues for the radiant dispersion are in good agreement with the values of 2°.47 and 1°.33 for RA and Dec obtained by Lindblad & Porubčan (1995). The speeds are normally distributed around a mean value of 58.6 km s−1 with a 1σ of 2.9 km s−1. This value is consistent with the value of 59.1 km s−1 given by Jenniskens et al. (2016). The median error in the estimation of the geocentric speed is 0.72 km s−1.
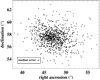 |
Fig. 7 Radiant dispersion of all meteors identified as Perseids. |
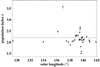 |
Fig. 8 High temporal resolution profile of the population index calculated from all years. The asymptotic red line indicates the nominal value of the shower at r = 2.2. |
4.3 Population index
We estimate an averaged magnitude distribution index over all years of r = 2.36 ± 0.05. The value iswithin the range of 1.75–2.36 found for the Perseids at the time of the perihelion passage of the comet in the years 1988–1994 by Brown & Rendtel (1996) and within the range of 1.9–2.5 published by Arlt & Händel (2000).
A high temporal resolution population index profile was obtained by first sorting the data in solar longitude and then forming bins of 50 events from which the population index and a mean λ⊙ were calculated (Fig. 8). By shifting each bin 25 events at a time, we derive the population index at different solar longitudes. The population index between λ⊙ = 128–136° and λ⊙ > 142° is nearly constant with a mean value r = 2.03 ± 0.03. This value is slightly lower than the value of r = 2.15 published by Brown & Rendtel (1996). A maximum of r = 3.58 ± 0.24 was found at λ⊙ = 136°.928 indicating an encounter with faint meteors. The sampling size of 50 events for the highest r-value corresponds to a time interval of 29.4 hr and was determined predominantly from meteors captured in 2013 (see Sect. 4.6).
Around the maximum of the shower the population index shows significant variation. Two prominent local maxima occur at solar longitudes 139°.517 and 139°.559 calculated from 2.19 and 1.88 hr of data respectively, always with a binsize of 50 events. A global minimum of r = 1.50 ± 0.05 is located at λ⊙ = 139°.679 calculated from data in 2015. The low population index indicates a dust population that consists primarily of large particles.
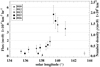 |
Fig. 9 Flux and number densities estimates for each observing night from all years. |
4.4 Flux
The meteor flux is calculated for each observing hour and averaged for each night. The reduced collecting areas were obtained with the method described in Sect. 3.3. The reduced areas vary for each hour since both the altitude of the radiant and the population index change with time. A population index was derived from all meteors captured in a single night. This index was used then to calculate the individual reduced collecting areas as a function of the radiant altitude at the reference height of 103 km.
Figure 9 shows the averaged fluxes and the corresponding spatial number densities over each observing night between λ⊙ = 134–144° from all years. The highest flux of Q(m) = 5.16 × 10⁻⁴ km−2 hr−1 was found for the night of August 11–12, 2016 using a population index of r = 2.38. The flux values acquired in this work are on average 2.3 times higher than the values found in the Visual Meteor Database (VMDB) published by the International Meteor Organisation (IMO). For the comparison, the flux values reported by the IMO were extrapolated to meteoroids of +0.2 or brighter, in order to match our meteor limiting-magnitude. For the extrapolation we used different population indices for each year, provided together with the meteor fluxes. These normalised results obtained by the IMO must be interpreted with caution due to the exponential relation between meteors of different magnitude which can lead to large errors in the extrapolated values when using incorrect r-values.
4.5 The 2016 outburst
Several modellers predicted outbursts for the night of August 11–12, 2016, associated with close encounters of different trails. The 1-revolution dust trail generated in 1862 was predicted to encounter Earth between 22:36 and 22:47 UT showing a moderate meteor activity (Jenniskens 2006; Maslov 2016). An older 4-revolution dust trail produced in 1479 was predicted to encounter the Earth at 23:23 UT with a meteor rate above the background rate by Maslov (2016). Cooke et al. considered several dust trails in their model and found that at 00:36 UT in August 12, meteor activity will be twice as high as at the annual peak of the shower (for a list of outbursts see Miskotte & Vandeputte 2017). Additional outbursts were predicted to occur during the morning hours when the brightness of the sky did not allow SPOSH observations.
A first quarter Moon was visible until 21 UT. The change in mean sky brightness of the SPOSH images acquired during the night of the outburst between 19 and 02 UT was up to 0.35 magnitudes for both observing stations whereas during a typical moonless night the deviation is practically zero for the same time period (Fig. 10).
The corrected hourly rates (Eq. (2)) for the night of August 11–12 were calculated at 30-min timeintervals (Fig. 11). To correct for the altitude of the radiant, a value of γ = 1.0 was used. For data consistency, rates were computed during the entire night including the early hours between 18 and 21 UT. In order to determine whether the meteor activity in that night was stronger than the annual meteor activity, the cHR of the shower was calculated using data acquired in 2015 between solar longitudes 138°.56 and 139°.84. These meteor rates were corrected for the altitude of the radiant while time intervals with the radiant being lower than 20° and data acquired after 02 UT were not taken into account.
Increased meteor activity was observed during the time interval 20:45–00:15 UT. A maximum was reachedin the interval 22:15–22:45 UT when the encounter with the one-revolution dust trail of 1862 was predicted to occur. The highest meteor rate was observed between 23:15 and 23:45 UT (λ⊙ = 139°.46–139°.48) and was approximately twice as high as the usual meteor activity. This peak at 23:30 ± 15′ matches well the prediction of 23:23 UT published by Maslov (2016). The activity level decreased significantly after this peak remaining relative low for the next 2 hr, reaching again the normal annual level in the time interval 01:45–02:15 UT.
A population index was estimated from 39 meteors, from which the brightness was estimated, occurring in the period 23–00 UT which corresponds to the period with the highest meteor activity. The estimated value was r = 2.19 ± 0.08 valid for the hour-long interval of solar longitudes λ⊙ = 139°.45–139°.49. This value is significantly higher than the value of r = 1.92 ± 0.06 computed from data in 2015 obtained between λ⊙ = 139°.52–139°.83. This implies that in 2016 Earth encountered a young dust trail, presumably that of 1479, characterised by a relative high r-value. The meteoroid flux within this hour was estimated at 6.1 × 10⁻⁴ km−2 hr−1 and found to be approximately twice as high as the average flux computed in 2015. The different levels of activity between this young trail and the annual meteor population is not shown in sufficient numbers in our dataset. However, the difference inthe meteoroid flux is expected to be 4.8 times higher when accounting for meteoroids as faint as +6.5.
The mean radiant position of the 43 outburst meteors is RA = 46°.4 and Dec = 57°.7 after correcting for radiant drift. The mean radiant of all Perseids from different years is located within the 1–σ ellipse of the sub-set of meteors captured in 2016 (Fig. 12).
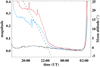 |
Fig. 10 Relative sky brightness due to lunar straylight for the night of August 11–12, 2016 (blue: Mainalon, red: Parnon). The black line shows sky brightness for a moonless night for reference (August 18, 2012). The dashed line gives the lunar altitude above the horizon (see axis annotation on the right). |
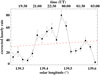 |
Fig. 11 Corrected hourly rates for the night August 11–12, 2016 in 30 min time intervals as a function of time. The dashed red line represents the background meteor activity calculated from data obtained in 2015. |
4.6 The 2013 dust trail
A population index of r = 3.58 ± 0.24 was obtained from 50 meteors detected in the two nights between solar longitudes 136°.261–137°.442 in 2013. The unusually high r-value implies a dust trail that consists primarily of small dust particles of possibly common origin (Brown & Rendtel 1996). Consequently, a high number of meteors are expected to be observed in the same time period. However, the meteor rates we calculated using data acquired in 2013 – in the time period mentioned above – do not show any peak. The reason for this contradictory result can be explained by the relatively high meteor limiting-magnitude of −0.2, calculated from the 50 meteors. Figure 13 shows the magnitude distribution (binsize = 0.5) of the data in 2013 compared with the complete meteor dataset. From the plot it can be seen that meteors brighter than −2.5 magnitudes are missing from the two nights in 2013 leading to the high r-value.
The presence of a relatively high fraction of faint meteors in the dust trail, can be verified by examining the number of low-mass meteors observed within the specified time period in 2013. Contrary to our expectations, we find no peak in data obtained by the IMO video meteor network presented in Molau et al. (2013), assuming that video camera systems are typically more sensitive to fainter meteors than the SPOSH. We note here that the population indices published in Molau et al. (2013) were not derived directly from meteor magnitudes. Furthermore, the data they used for the calculations were acquired by a large number of cameras with different characteristics. It is unclearwhether this feature occurs in other years since data from this time period are missing from our dataset.
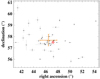 |
Fig. 12 Radiant positions and errors of 43 Perseids captured during the 2016 outburst between 23 and 00 UT. The cross represents the mean radiant position with the 1–σ uncertainties as error bars. The mean radiant of all Perseids is shown as a red diamond. |
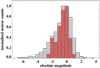 |
Fig. 13 Superimposed histograms showing the magnitude distribution between the data in 2013 contributing to the high r-value (red) and all Perseids in our dataset. |
5 Discussion
We determined the spatial and temporal variation of the Perseid meteor shower from seven years of observations between 2010 and 2016. These observations were performed with the SPOSH camera system, generating image data of high geometric and radiometric quality while offering a near all-sky coverage. This allows the estimation of the dynamic and photometric properties of a large number of meteors with a high accuracy. This work provides a detailed characterisation of the Perseid meteoroid stream through a systematic observation of the meteor shower. Similar studies of the Perseid stream have not, to our knowledge, been reported in recent years.
From the analysis of the acquired data, the Perseid meteor shower is active throughout a relatively long time period between late July (~ 124°) and mid-to-late August (~ 147°). Earth enters the core part of the Perseid stream, producing the annual meteor shower, at solar longitude λ⊙ = 138°. The meteor rate reaches a maximum at λ⊙ = 140°.08 ± 0°.07 computed from all Perseids after excluding outburst meteors occurring in August 11–12, 2016. Although the location of the peak of the shower varies from year to year, our value is consistent with a mean maximum at λ⊙ = 139°.96 ± 0°.05, calculated over the years 1988–1994 by Brown & Rendtel (1996).
Increased activity was predicted for 2016 by individual studies (Jenniskens 2006; Maslov 2016). The unusually high meteor rates were attributed to different dust trails which were perturbed by Jupiter to Earth-crossing orbits (Wu & Williams 1993; Brown 1999; Maslov 2016). In the time between 23:15 and 23:45 UT we observed a meteor rate approximately twice as high as the annual rate. The time of occurrence matches the predicted activity caused by the 4-revolution dust trail produced in 1479 (Maslov 2016). This dust trail was last observed in 2004 (Rendtel 2008). However, the activity during the outburst was found in this work to be less strong than the one derived from visual observations (Miskotte & Vandeputte 2017; Molau et al. 2017). We believe that the lower rates are related to the relatively high population index of r = 2.19 we found for the reported time interval, compared to the r-value of 1.92 obtained by data in 2015 at similar solar longitudes. Thus, it is expected that higher meteor rates could be observed only at lower masses.
We find a nearly constant population index of r = 2.03 ± 0.03 for the time between λ⊙ = 128°–136° and λ⊙ > 142°. This value is slightly lower than the value of r = 2.17 found in previous studies (Brown & Rendtel 1996). A high r-value of 3.58 ± 0.24 was found at solar longitudes λ⊙ = 136°.261–137°.442 from data observed in 2013. The high population index and temporal distribution of the corresponding data suggest an encounter with a dust trail rich in faint meteors and spatially strongly scattered. However, the levels of the corresponding meteor activity derived from our data are close to the annual rates. We believe that this is due to the meteor limiting-magnitude of our camera system which is sensitive to rather bright meteors. Given the high r-value, increased activity is expected to occur at particles with lower masses, though no signs of high meteor activity was reported by visual or video observations (Molau et al. 2013).
The shape of the activity curve around the peak of the shower was described through the slope of the ascending and descending branches. The values for the slopes were obtained by fitting a straight line to the corrected hourly rates in logarithmic scale as a function of the solar longitude. We derived a value of B = 0.18 ± 0.06 for the ascending branch and B = 0.29 ± 0.03 of the descending one. Although the slope for the pre-peak activity of the shower matches the value of B = 0.20 ± 0.01 published by Jenniskens (1994), the descending branch appears to be steeper. This difference could be due to our poorer sampling of the post-maximum branch of the shower (λ⊙ > 140°).
The radiant dispersion of the shower was found to be 2°.59 in RA and 1°.37 in Dec while the median error was 0°.6 and 0°.2 for RA and Dec, respectively. The values for the radiant dispersion agree with the values of 2°.8 and 1°.7 for RA and Dec given by Jenniskens et al. (2016).
Future outbursts have been predicted for the years 2019–2021 generated by the Ursids and the Draconids occurring every year in December and October respectively (Jenniskens 2006). These outbursts will be visible from observing sites located in central Europe. Observing showers with different characteristics than the Perseids will test the robustness and identifypossible limitations of our reduction software. In the case of meteors with low geocentric velocities, shorter shutter-breaks are expected which need to be identified for the estimation of the speed. Another implication of the low velocity of a meteor is a shorter meteor trail. Shorter meteor trails affect the determination of the meteor pathon the image plane due to the limited number of data points. Regarding the observations of meteors of different radiant, the location of observing sites will need to be reassessed in order to maximise the convergence angle. This can be done by considering the geometric configuration of the stations with respect the radiant of the shower.
Further work is needed to explain the various patterns of meteor activity in our dataset. Investigating the heliocentric orbits of meteors from different years will allow a direct comparison with findings from theoretical models (Wu & Williams 1993; Brown & Jones 1998; Vaubaillon et al. 2005). Further modelling to account for the deceleration of a meteoroid in the Earth’s atmosphere, will need to be performed when observing meteors with low entry velocities. Inferences on the meteoroid material and parent body can be made by studying the light curves of the stream meteors (Koten et al. 2004; Jenniskens et al. 2008; Subasinghe et al. 2016). These topics are reserved for a future study.
6 Conclusions
This study provides an analysis of the Perseids acquired between 2010 and 2016 with the SPOSH cameras. The image data were reduced using software, developed to exploit the excellent capabilities of the imaging system. From seven years of observations, we detect 3318 double-station meteors from which 934 identified as Perseids based on their characteristics. The predicted outburst in 2016 could be confirmed from the analysis of the data. However, not all of the predicted dust trails could be verified.
The observations cover the relative long meteor activity of the shower from late July to mid-to-late August. Our study is based on uniform data, reduced with dedicated software, allowing a detailed characterisation of the Perseid meteor shower. Employing high-resolution light-sensitive cameras while accounting for the geometry between the locations of the observing sites and the radiant during predicted meteor outbursts can lead to more accurate meteor data which we can be utilised for the understanding of the stream formation and meteoroid evolution.
Acknowledgements
The authors would like to thank the reviewer, Detlef Koschny, for his useful comments and suggestions on the manuscript. We wish to acknowledge the assistance and support of Stephan Elgner, Dr. Joachim Flohrer, Dr. Frank Sohl, Daniel Wahl, Omar Al-Juboori, and all the participants of the observing campaigns. We also would like to thank Vagelis Tsamis from the Astronomical Association of Sparta and the Hellenic Mountaineering Club of Tripolis for assisting the organisation of our field campaigns.
References
- Arlt, R., & Händel, I. 2000, WGN, J. Int. Meteor Org., 28, 166 [NASA ADS] [Google Scholar]
- Bellot Rubio, L. R. 1994, WGN, J. Int. Meteor Org., 22, 118 [NASA ADS] [Google Scholar]
- Blaauw, R. C., Campbell-Brown, M., & Kingery, A. 2016, MNRAS, 463, 441 [NASA ADS] [CrossRef] [Google Scholar]
- Brown, P. G. 1999, PhD Thesis, The university of Western Ontario, Canada [Google Scholar]
- Brown, P., & Jones, J. 1998, Icarus, 133, 36 [NASA ADS] [CrossRef] [Google Scholar]
- Brown, P., & Rendtel, J. 1996, Icarus, 124, 414 [NASA ADS] [CrossRef] [Google Scholar]
- Christou, A. A., Margonis, A., & Oberst, J. 2015, A&A, 581, A19 [NASA ADS] [CrossRef] [EDP Sciences] [Google Scholar]
- Elgner, S., Oberst, J., Flohrer, J., & Albertz, J. 2006, in Fifth International Symbosium Turkish-German Joint Geodetic Days [Google Scholar]
- Gural, P. S. 2002, in Proceedings of the International Meteor Conference, 20th IMC, Cerkno, Slovenia, 2001, eds. M. Triglav, A. Knöfel, & C. Trayner (Belgium: International Meteor Organization), 29 [Google Scholar]
- Harris, N. W., & Hughes, D. W. W. 1995, MNRAS, 273, 992 [NASA ADS] [CrossRef] [Google Scholar]
- Jenniskens, P. 1994, A&A, 287, 990 [NASA ADS] [Google Scholar]
- Jenniskens, P. 2006, Meteor Showers and their Parent Comets (Cambridge: Cambridge University Press) [CrossRef] [Google Scholar]
- Jenniskens, P., Betlem, H., de Lignie, M., et al. 1998, MNRAS, 301, 941 [NASA ADS] [CrossRef] [Google Scholar]
- Jenniskens, P., de Kleer, K., Vaubaillon, J., et al. 2008, Icarus, 196, 171 [NASA ADS] [CrossRef] [Google Scholar]
- Jenniskens, P., Nénon, Q., Albers, J., et al. 2016, Icarus, 266, 331 [NASA ADS] [CrossRef] [Google Scholar]
- Koschny, D., & Diaz del Rio, J. 2002, WGN, J. Int. Meteor Org., 30, 87 [NASA ADS] [Google Scholar]
- Koten, P., Borovička, J., Spurný, P., Betlem, H., & Evans, S. 2004, A&A, 428, 683 [NASA ADS] [CrossRef] [EDP Sciences] [Google Scholar]
- Lindblad, B. A., & Porubčan, V. 1995, Earth Moon and Planets, 68, 409 [NASA ADS] [CrossRef] [Google Scholar]
- Lyytinen, E., & van Flandern, T. 2004, WGN, J. Int. Meteor Org., 32, 51 [NASA ADS] [Google Scholar]
- Margonis, A., Christou, A., & Oberst, J. 2018, A&A, 618, A99 [NASA ADS] [CrossRef] [EDP Sciences] [Google Scholar]
- Maslov, M. 2016, Earth Moon and Planets, 117, 93 [NASA ADS] [CrossRef] [Google Scholar]
- Miskotte, K., & Vandeputte, M. 2017, eMeteorNews, 2, 61 [NASA ADS] [Google Scholar]
- Molau, S., Kac, J., Crivello, S., et al. 2013, WGN, J. Int. Meteor Org., 41, 201 [NASA ADS] [Google Scholar]
- Molau, S., Crivello, S., Goncalves, R., et al. 2017, WGN, J. Int. Meteor Org., 45, 13 [NASA ADS] [Google Scholar]
- Oberst, J., Flohrer, J., Elgner, S., et al. 2011, Planet. Space Sci., 59, 1 [NASA ADS] [CrossRef] [Google Scholar]
- Rendtel, J. 2008, WGN J. Int. Meteor Org., 36, 68 [NASA ADS] [Google Scholar]
- SonotaCo. 2009, WGN, J. Int Meteor Org., 37, 55 [Google Scholar]
- Southworth, R. B., & Hawkins, G. S. 1963, Smithsonian Contrib. Astrophys., 7, 261 [Google Scholar]
- Subasinghe, D., Campbell-Brown, M. D., & Stokan, E. 2016, MNRAS, 457, 1289 [NASA ADS] [CrossRef] [Google Scholar]
- Vaubaillon, J., Colas, F., & Jorda, L. 2005, A&A, 439, 751 [NASA ADS] [CrossRef] [EDP Sciences] [Google Scholar]
- Verniani, F. 1973, J. Geophys. Res., 78, 8429 [NASA ADS] [CrossRef] [Google Scholar]
- Wiśniewski, M., Ẓoła̧dek, P., Olech, A., et al. 2017, Planet. Space Sci., 143, 12 [NASA ADS] [CrossRef] [Google Scholar]
- Wu, Z., & Williams, I. P. 1993, MNRAS, 264, 980 [NASA ADS] [CrossRef] [Google Scholar]
Height refers to altitude above sea level.
All Tables
Observing periods, observing times, and total number of meteors and Perseids for each meteor campaign.
All Figures
|
Fig. 1 Typical SPOSH image showing a meteor captured from Parnon observing site on August 12, 2010 at 19:06:40. The meteor trail is intercepted by the rotating shutter generating meteor segments of 0.06 s. |
| In the text | |
|
Fig. 2 Left panel: histogram of the number of observing hours for each station as a function of the solar longitude accumulated from seven years of observations (2010–2016). Right panel: number of meteors detected from each station for the same time window. The use of the rotating shutter in one of the stations reduces the effective exposure time and results in a lower number of observed meteors. The binsize for both histograms is 1°. |
| In the text | |
|
Fig. 3 Corrections computed using the magnitude loss function for the field-of-view of the camera. Each square has an angular distance of five degrees. The coloured squares represent the overlapping area of the two stations at a height of 100 km, assuming a circular field-of-view of 60° radius. The colours represent the amount of loss in magnitude. Areas with cold colours represent parts of the field-of-view where meteors will appear fainter, while meteors appearing in hot-coloured squares will appear brighter. Meteors located in the red squares will appear as point-like sources since this area indicates the apparent position of the radiant. Left figure: radiant is located at azimuth = 45°, altitude = 50°. Right figure: at azimuth = 70°, altitude = 80° with respectto the camera viewing direction. |
| In the text | |
|
Fig. 4 Cumulative number of Perseids as a function of their absolute magnitudes. The population index r = 2.36 is derived from the slope of the line. The intersection of the lines defines the meteor limiting-magnitude of the camera system. |
| In the text | |
|
Fig. 5 Corrected hourly rates of the Perseids calculated for each observing night at two-hour intervals. Each symbol in this plot represents a different year. |
| In the text | |
|
Fig. 6 Activity curve shape of the shower around its maximum. The slope of the two straight lines describes the intensity of increasing and decreasing meteor rates at the peak and characterises the stream. |
| In the text | |
|
Fig. 7 Radiant dispersion of all meteors identified as Perseids. |
| In the text | |
|
Fig. 8 High temporal resolution profile of the population index calculated from all years. The asymptotic red line indicates the nominal value of the shower at r = 2.2. |
| In the text | |
|
Fig. 9 Flux and number densities estimates for each observing night from all years. |
| In the text | |
|
Fig. 10 Relative sky brightness due to lunar straylight for the night of August 11–12, 2016 (blue: Mainalon, red: Parnon). The black line shows sky brightness for a moonless night for reference (August 18, 2012). The dashed line gives the lunar altitude above the horizon (see axis annotation on the right). |
| In the text | |
|
Fig. 11 Corrected hourly rates for the night August 11–12, 2016 in 30 min time intervals as a function of time. The dashed red line represents the background meteor activity calculated from data obtained in 2015. |
| In the text | |
|
Fig. 12 Radiant positions and errors of 43 Perseids captured during the 2016 outburst between 23 and 00 UT. The cross represents the mean radiant position with the 1–σ uncertainties as error bars. The mean radiant of all Perseids is shown as a red diamond. |
| In the text | |
|
Fig. 13 Superimposed histograms showing the magnitude distribution between the data in 2013 contributing to the high r-value (red) and all Perseids in our dataset. |
| In the text | |
Current usage metrics show cumulative count of Article Views (full-text article views including HTML views, PDF and ePub downloads, according to the available data) and Abstracts Views on Vision4Press platform.
Data correspond to usage on the plateform after 2015. The current usage metrics is available 48-96 hours after online publication and is updated daily on week days.
Initial download of the metrics may take a while.