Fig. 9.
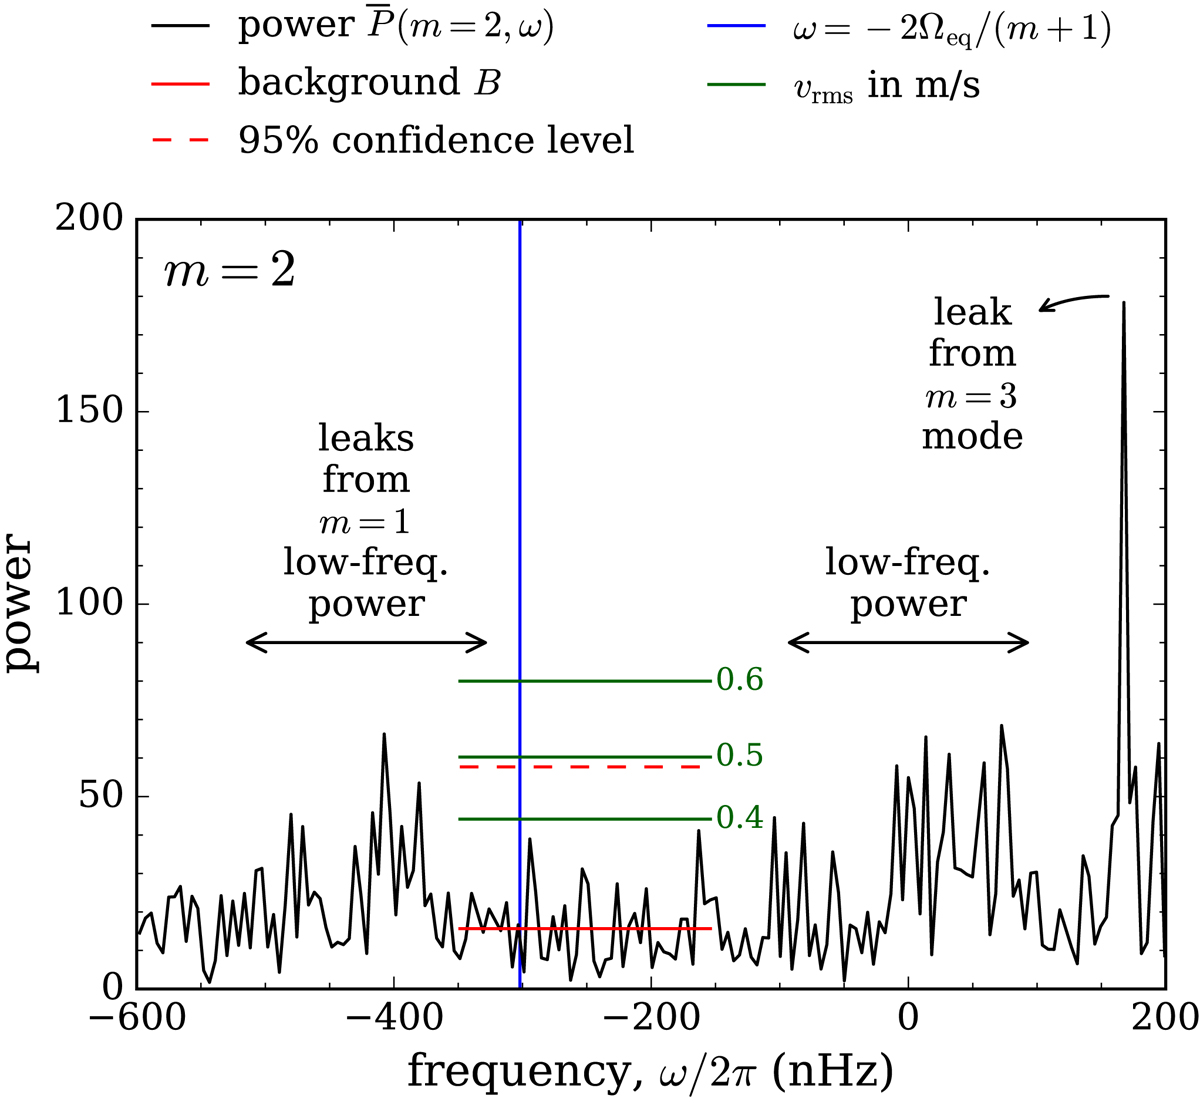
Power spectrum of south-north travel-time shifts ![]() for m = 2 (black solid line). The blue vertical line indicates the frequency of the classical m = 2 sectoral r mode. The red solid line is the background B estimated by a fit to the power in the frequency range between −350 and −150 nHz. The red dashed line is the threshold for 95% confidence level; that is, the noise in the background only has a 5% chance of being higher than this threshold for at least one frequency bin. We note that the spike around −295 nHz (on the right side of the blue line) is above the background but much lower than the 95% confidence level. The three green lines indicate the power that would correspond to a m = 2 sectoral mode with rms velocity of 0.4, 0.5, or 0.6 m s−1.
for m = 2 (black solid line). The blue vertical line indicates the frequency of the classical m = 2 sectoral r mode. The red solid line is the background B estimated by a fit to the power in the frequency range between −350 and −150 nHz. The red dashed line is the threshold for 95% confidence level; that is, the noise in the background only has a 5% chance of being higher than this threshold for at least one frequency bin. We note that the spike around −295 nHz (on the right side of the blue line) is above the background but much lower than the 95% confidence level. The three green lines indicate the power that would correspond to a m = 2 sectoral mode with rms velocity of 0.4, 0.5, or 0.6 m s−1.
Current usage metrics show cumulative count of Article Views (full-text article views including HTML views, PDF and ePub downloads, according to the available data) and Abstracts Views on Vision4Press platform.
Data correspond to usage on the plateform after 2015. The current usage metrics is available 48-96 hours after online publication and is updated daily on week days.
Initial download of the metrics may take a while.