Fig. 8.
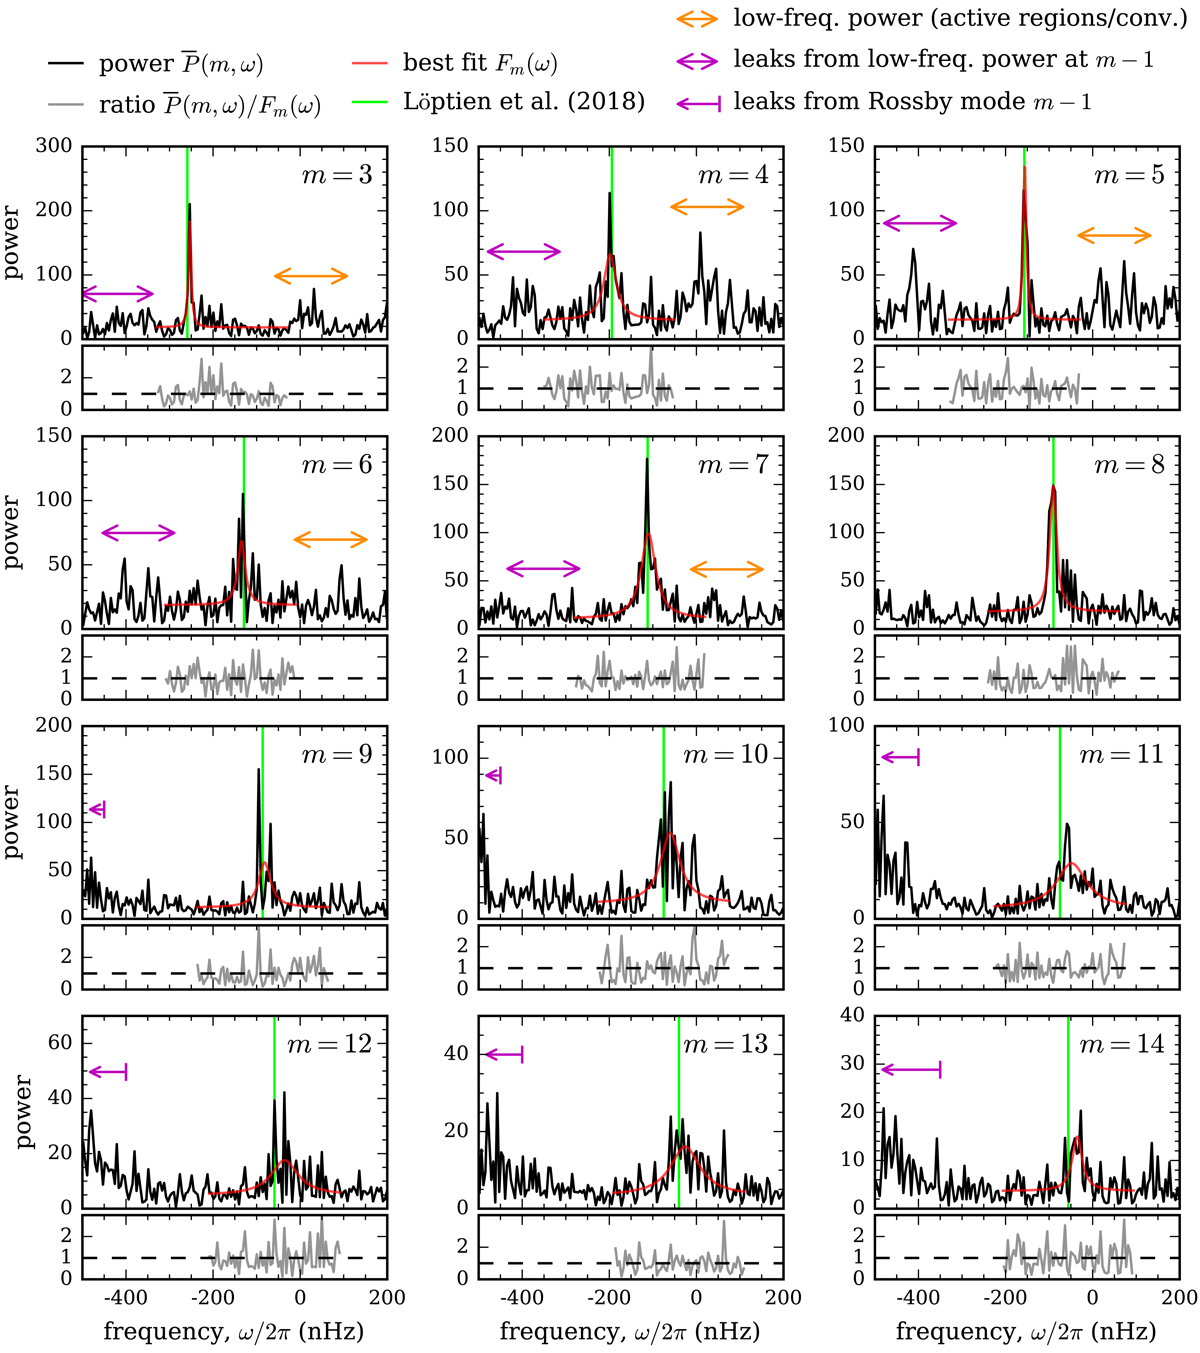
Power spectra of south-north travel-time shifts ![]() for modes in the range 3 ≤ m ≤ 14 (black curves, with the frequency resolution 1/T = 4.5 nHz). The travel times are measured in the frame rotating at equatorial rotation rate Ωeq/2π = 453.1 nHz. The red lines are the fits Fm(ω) given by Eq. (8). The green vertical lines indicate the mode frequencies from Löptien et al. (2018). The orange arrows mark the excess low-frequency power at low m that might be caused by active regions or large-scale convection. The purple arrows mark the leaks from the m − 1 r-mode power and the low-frequency power at m − 1. Each power spectrum is accompanied by a plot of the ratio
for modes in the range 3 ≤ m ≤ 14 (black curves, with the frequency resolution 1/T = 4.5 nHz). The travel times are measured in the frame rotating at equatorial rotation rate Ωeq/2π = 453.1 nHz. The red lines are the fits Fm(ω) given by Eq. (8). The green vertical lines indicate the mode frequencies from Löptien et al. (2018). The orange arrows mark the excess low-frequency power at low m that might be caused by active regions or large-scale convection. The purple arrows mark the leaks from the m − 1 r-mode power and the low-frequency power at m − 1. Each power spectrum is accompanied by a plot of the ratio ![]() in gray in the lower panel, which is expected to have a mean of unity (dashed line) and a constant variance if the fit is not biased.
in gray in the lower panel, which is expected to have a mean of unity (dashed line) and a constant variance if the fit is not biased.
Current usage metrics show cumulative count of Article Views (full-text article views including HTML views, PDF and ePub downloads, according to the available data) and Abstracts Views on Vision4Press platform.
Data correspond to usage on the plateform after 2015. The current usage metrics is available 48-96 hours after online publication and is updated daily on week days.
Initial download of the metrics may take a while.