Fig. 7.
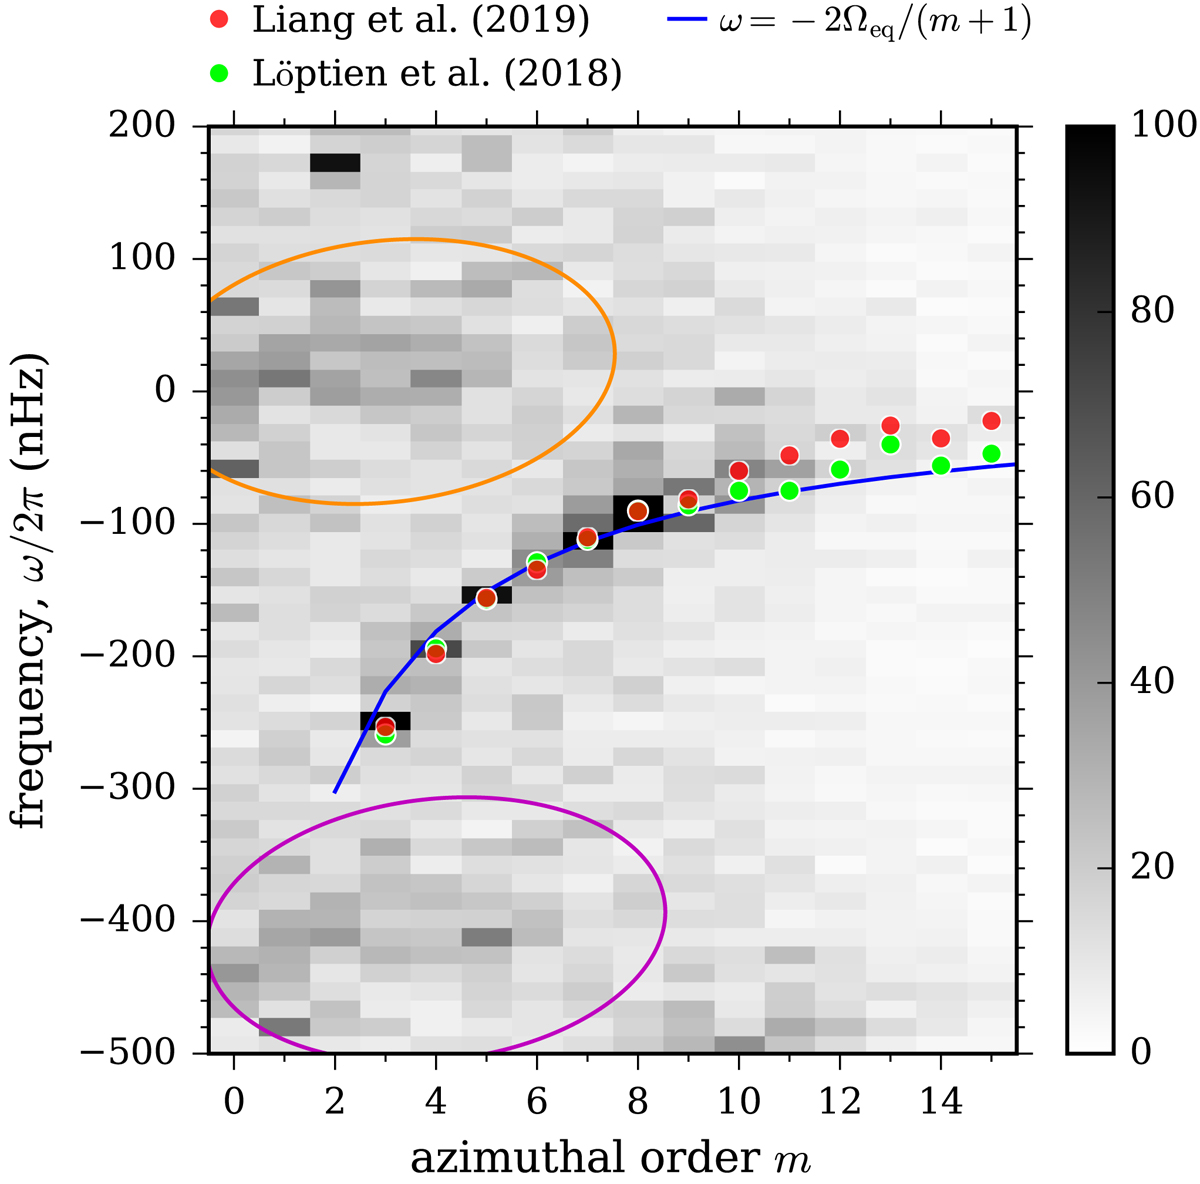
Enlargement of Fig. 6d around the frequency range of interest (see Fig. 8 for the line profiles of individual modes in the range 3 ≤ m ≤ 14). The red circles show the mode frequencies estimated from Lorentzian fits (see Sect. 2.3). The errors in the mode frequencies are given roughly by the size of the red circles (see errors in Table 1). For comparison, the mode frequencies measured by Löptien et al. (2018) are also indicated by green circles.
Current usage metrics show cumulative count of Article Views (full-text article views including HTML views, PDF and ePub downloads, according to the available data) and Abstracts Views on Vision4Press platform.
Data correspond to usage on the plateform after 2015. The current usage metrics is available 48-96 hours after online publication and is updated daily on week days.
Initial download of the metrics may take a while.